Overview
APPM collects and displays Oracle Database historical and current performance related data.
It collects performance data such as wait events and active session history. Collected data is stored in central repository and used to identify and analyze performance issues like resource intensive SQL statements.
One of its key features is to conveniently display information required to identify performance issues root causes. It also allows to drill down on identified performance bottlenecks.
It offers similar functionality as Oracle ASH/AWR, but it also works on Standard and Express Editions.
APPM Repository
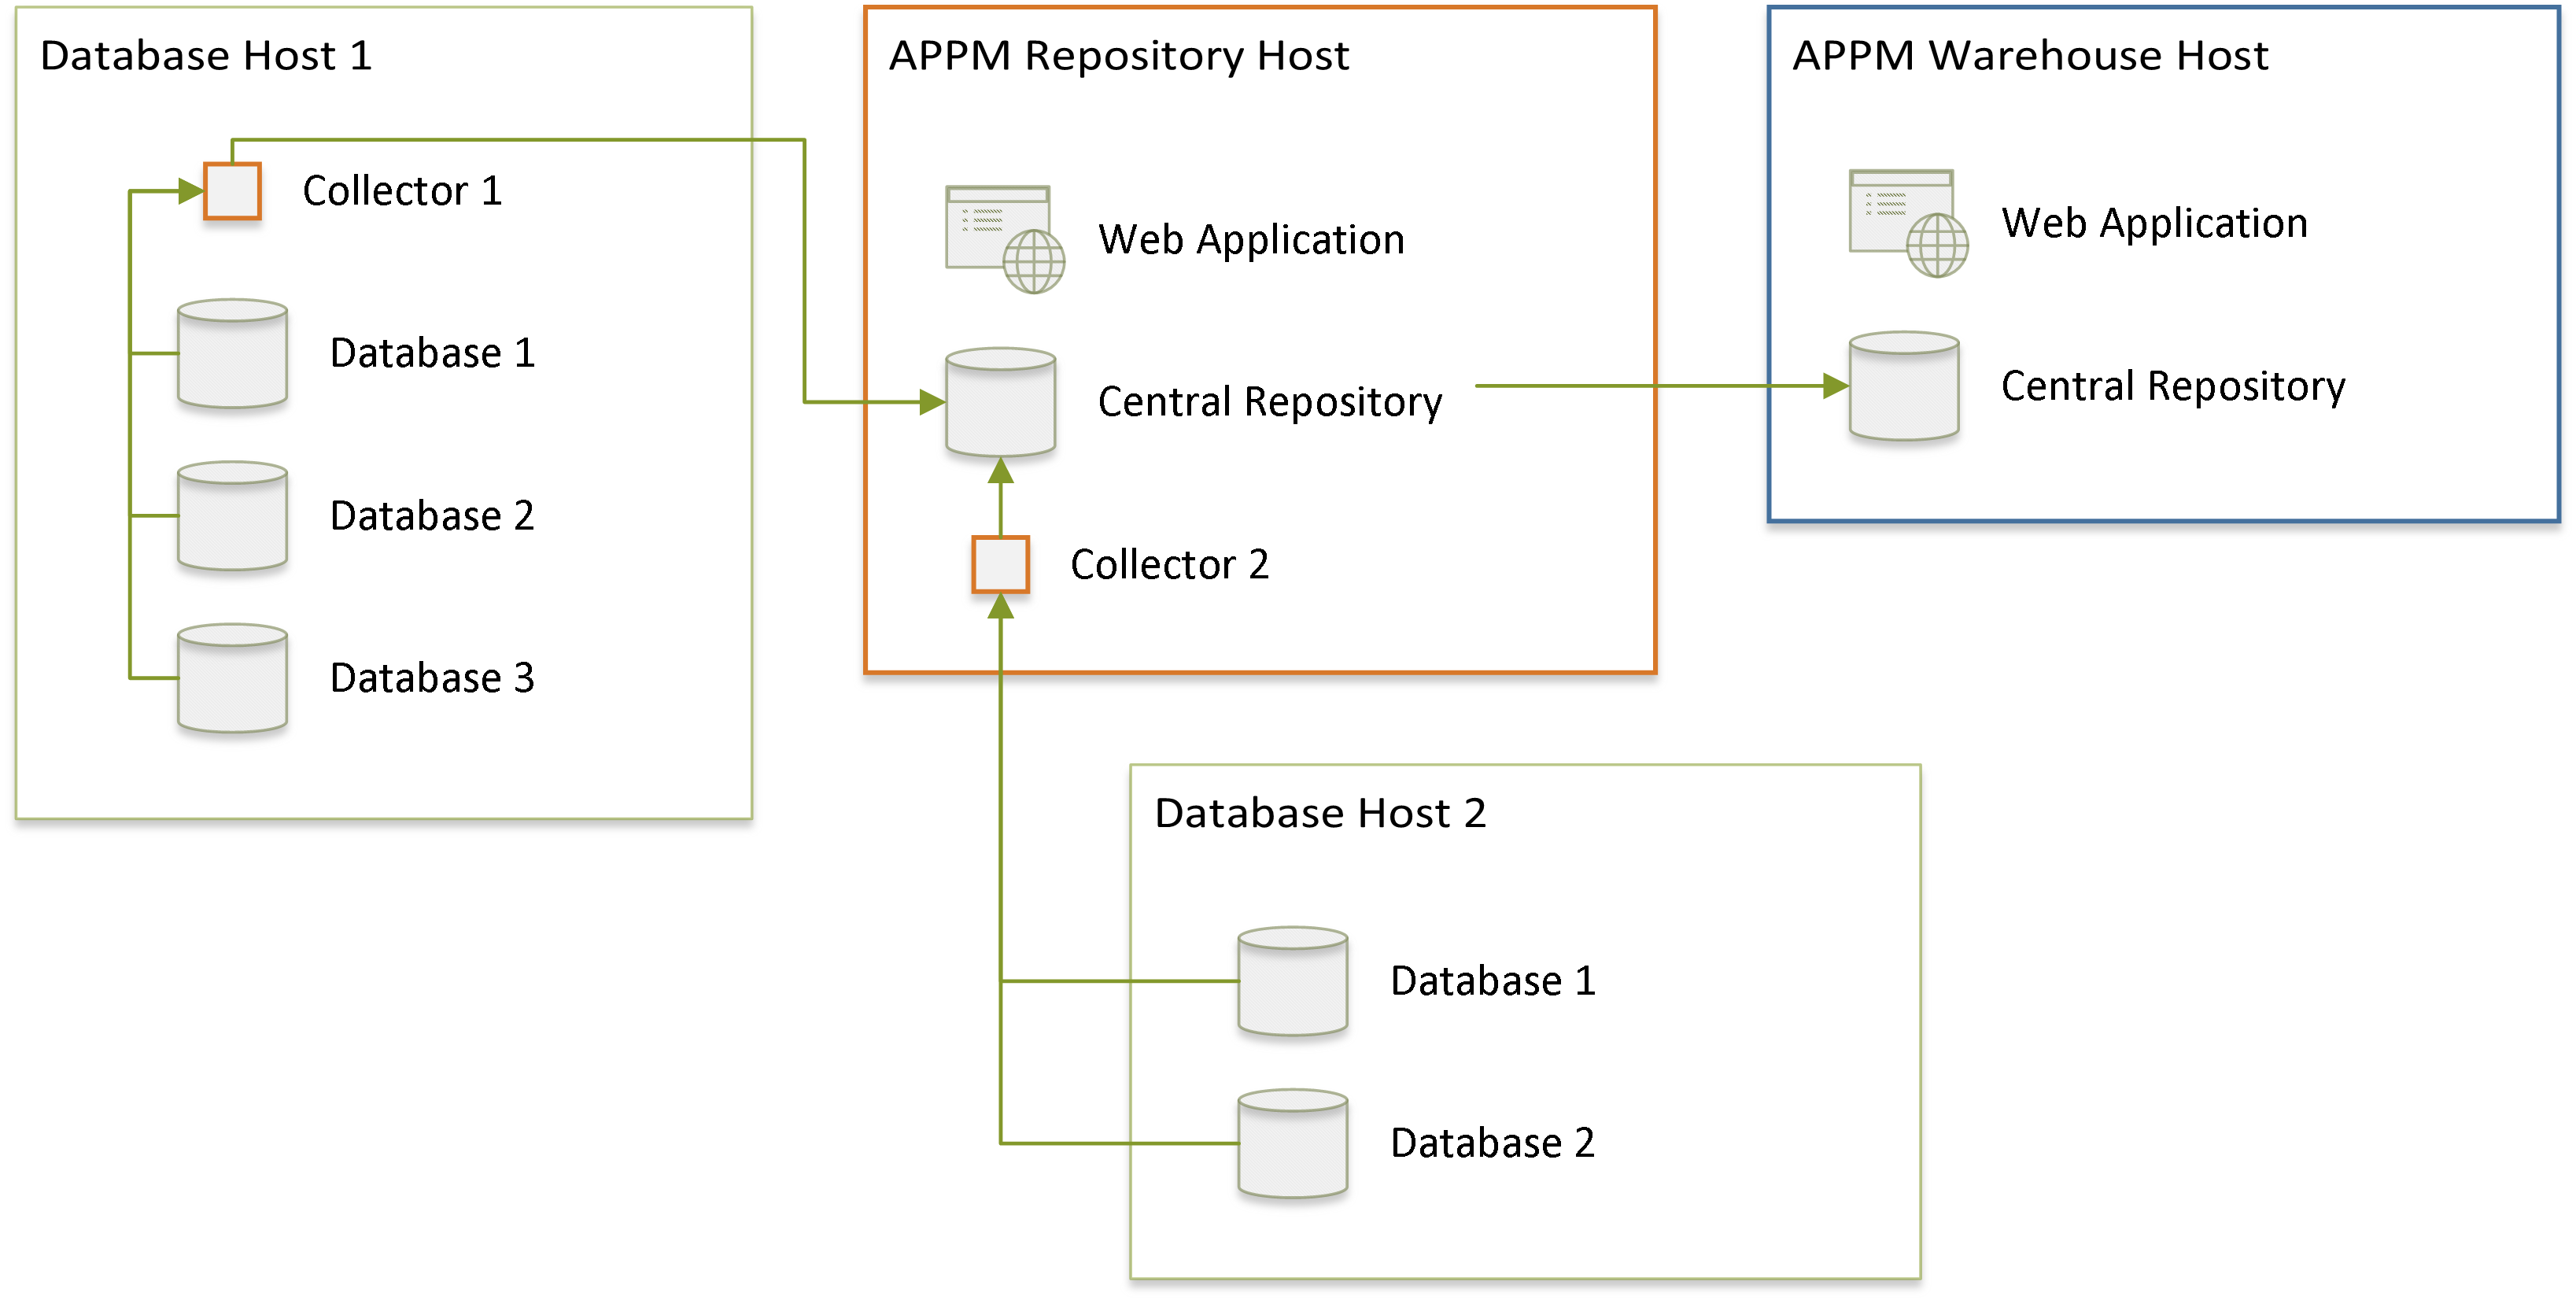
APPM Collector samples monitored database’s performance statistics and stores it in APPM Central Repository. Collection of samples has minimal performance impact on monitored databases. Repository database where samples are stored does not need any Oracle license.
APPM Collector can run on the same host as database or it can collect the samples via SQL*Net.
APPM Central Repository is based on docker containers and can run on any host that can run Docker Container. Usually, this is a dedicated virtual machine. It’s also possible to deploy it on Oracle Cloud.
Login
Repository Login
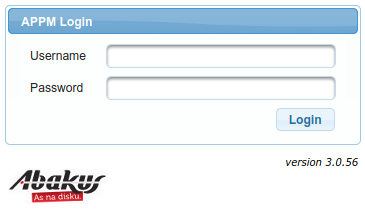
You can access web application interface at:
https://<hostname>/appm/
Default username and password after installation are:
-
Username:
admin -
Password:
change_me
Database Login
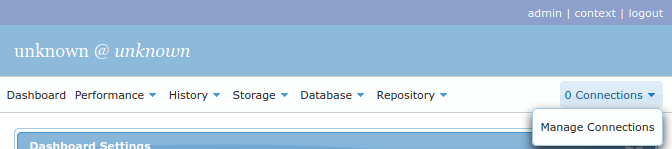
You may connect to running Oracle instances via SQL*Net to obtain data directly from the database, rather than
querying sampled data. You can do so by clicking n Connections → Manage Connections in upper right corner.
Everything under Performance, Storage and Database menus requires such SQL*Net connection, while all other menus refer only to
samples stored in repository database.
Context Fields
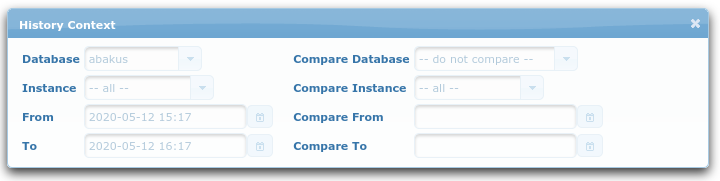
Note that some fields have "blue" labels, such as the ones in the screenshot above (you can open this popup
by clicking context in the top right corner).
Those context fields are session scoped and so they persist across the graphical interface among different pages.
History (based on collected samples)
Dashboard
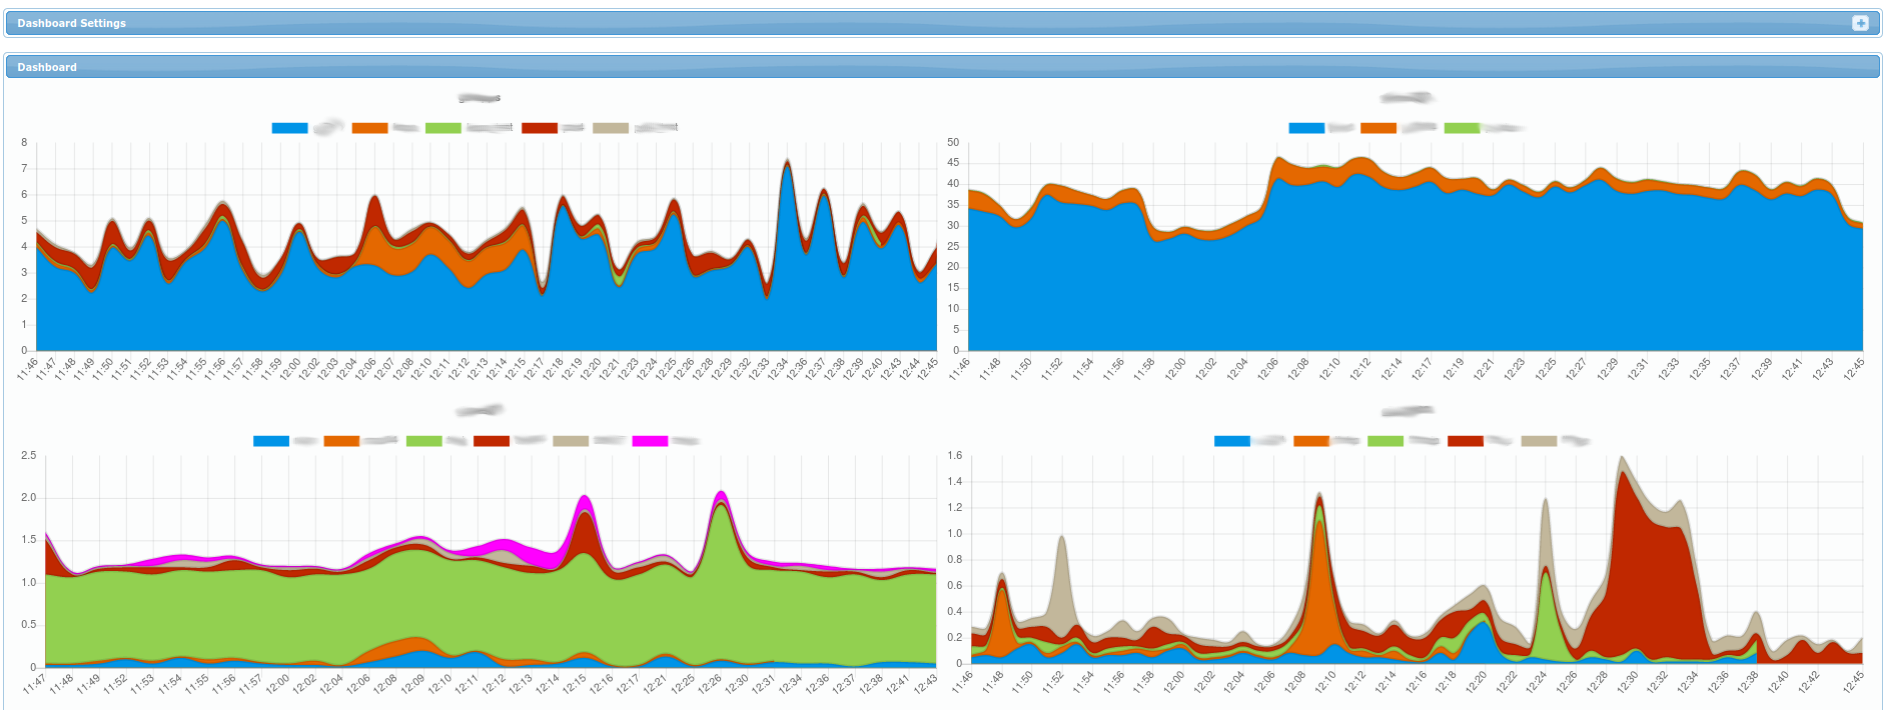
Each chart represents a single server (or cluster of RAC nodes in more advanced setups). Each color represents amount of active sessions for a specific database on that server.
Note that on right top corner, you can click the + on the top right to display Dashboard Settings
panel (it allows you to set time interval for which the charts are displayed - by default for
the last hour).
History → Active Sessions
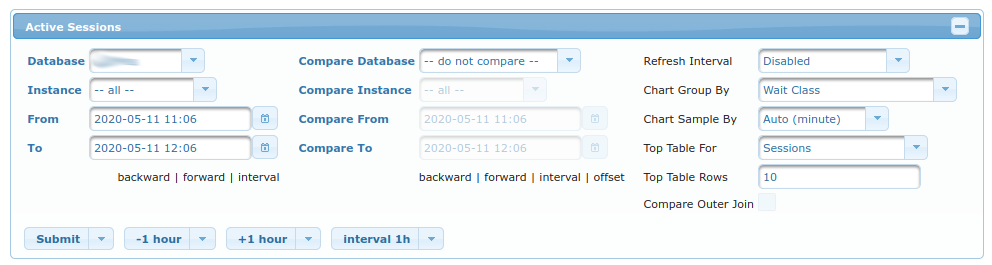
You must choose the database for which to display samples. This is done in the first column using fields:
-
Database- for which database to display the sampled data -
Instance- for which instance to display sampled data (only relevant for RAC setups) -
FromandTo- for which period to display sampled data (it defaults to last hour)
In second column of fields, you can choose which database/period you want to compare the results of first column to:
-
Compare Database- which database to compare results to -
Compare Instance- which instance to compare results to (only relevant for RAC setups) -
Compare FromandCompare To- which period to compare to (it defaults to last hour)
In third column of fields, you can fine-tune what/how is displayed:
-
Refresh Interval- If enabled, the results are refreshed everynseconds (and timestamp forwarded). -
Chart Group By- Count amount of active sessions by this field (by default aWait Class, but it’s interesting to see other results such asusernameorinstance; all of them refer to columns fromv$session. -
Chart Sample By- Amount of average sessions are averaged by this field (by minute, hour, or day). -
Top Table For- What to display inTop Tabletable bellow. Among the most interesting fields (other thanSessionwhich is default) are-
SQL- which displays most resource-consuming SQL-s -
PLAN- which displays most resource-consumgin Execution Plans. -
SQL (per execution)andPLAN (per execution)are different in that they display amount of resources consumed on average by single execution of SQL or it’s PLAN.
-
-
Top Table Rows- Amount of rows displayed inTop Table -
Compare Outer Join- Only relevant whenCompare Databaseis selected; It determines whether or not to display rows that are specific to either on or the other database (DatabaseandCompare Database).
Buttons are used to move through time more quickly - alternative would be to manually insert different dates into From and To fields.
Charts
ASH
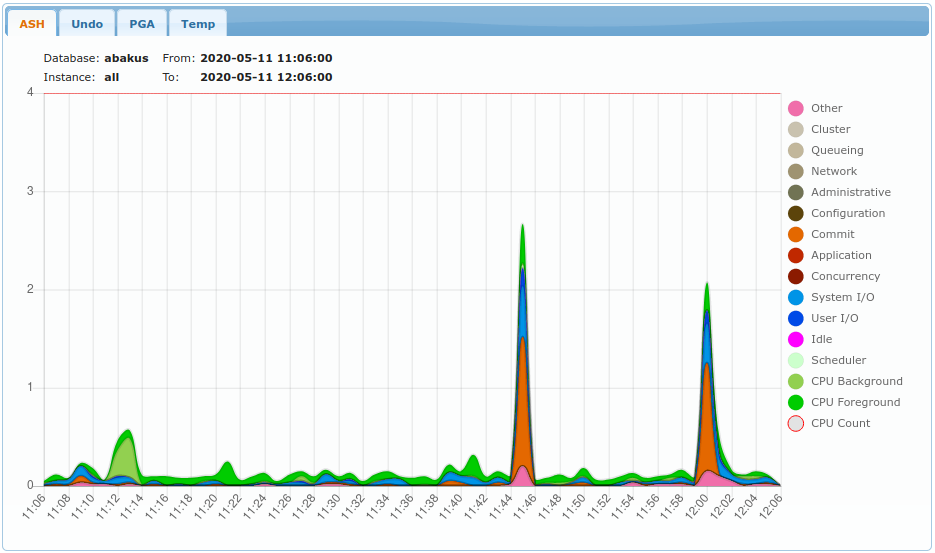
Legend displays what was selected in Chart Group By column.
On Y axis is the number of concurrently active sessions.
Data comes from samples of v$session view.
Undo
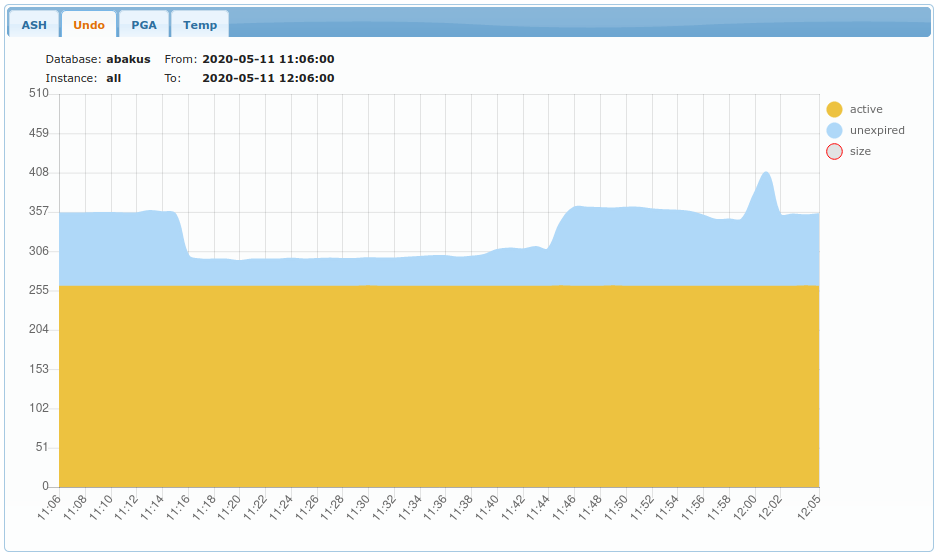
Displays amount of UNDO used in MB (megabytes). Data comes from samples of v$transaction.
PGA
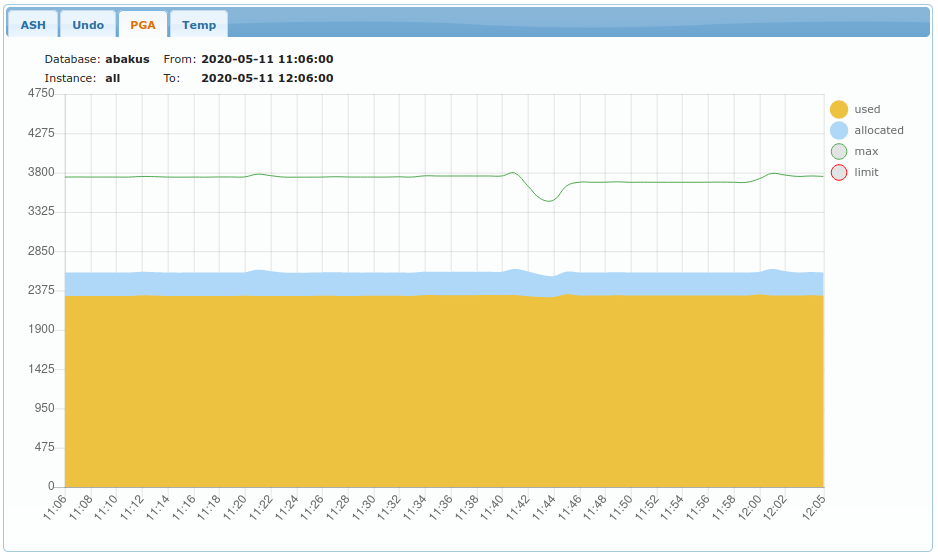
Displays amount of PGA used in MB (megabytes). Data comes from samples of v$process.
Temp
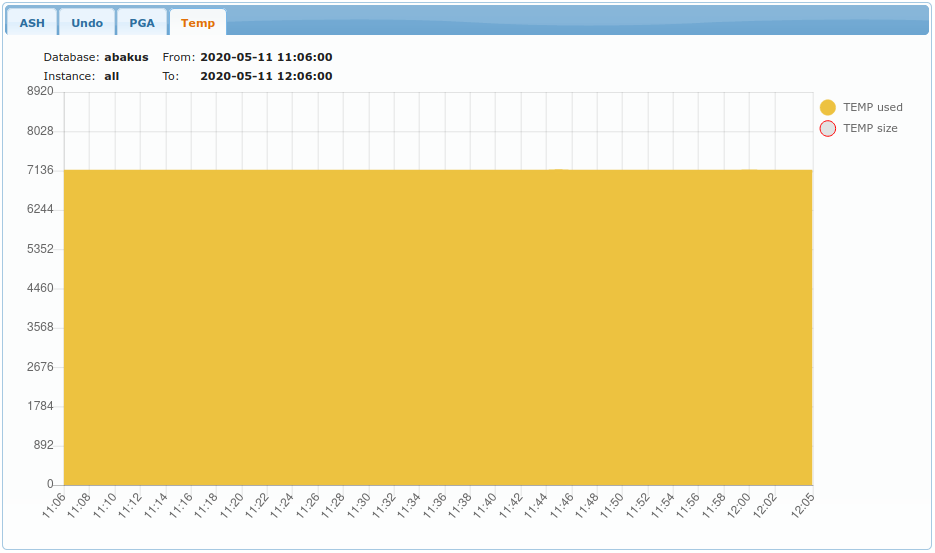
Displays amount of TEMP space usage (by temp tablespaces).
Top table
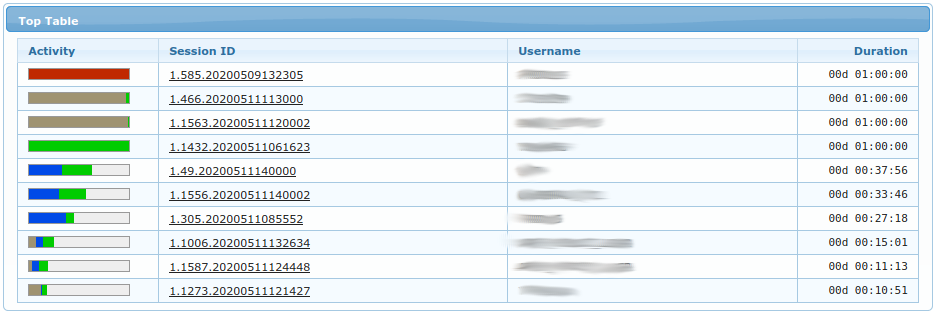
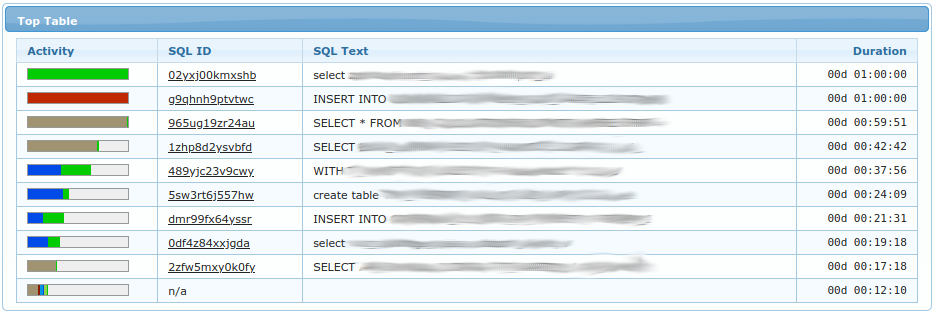
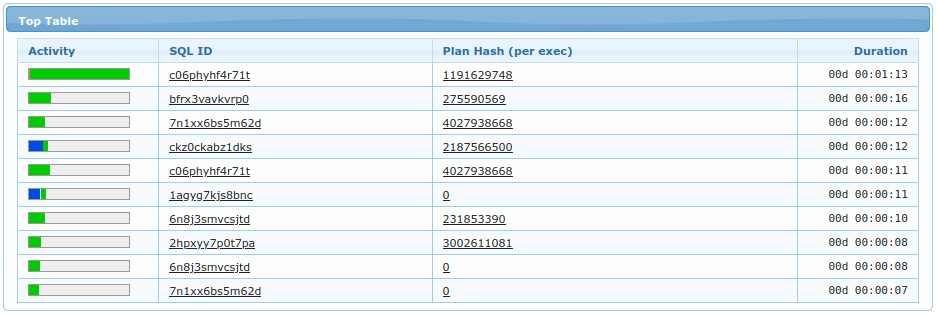
Top table displays what was selected in Top Table For field. Examples above are for Sessions, SQL and PLAN.
You can click on specific sql_id or specific plan_hash_value to see details of selected SQL or Plan.
Activity column displays how many times this object was seen in regard to the object displayed in first row.
Duration column displays amount of times (=seconds) such object was seen as ACTIVE in v$session.
Last
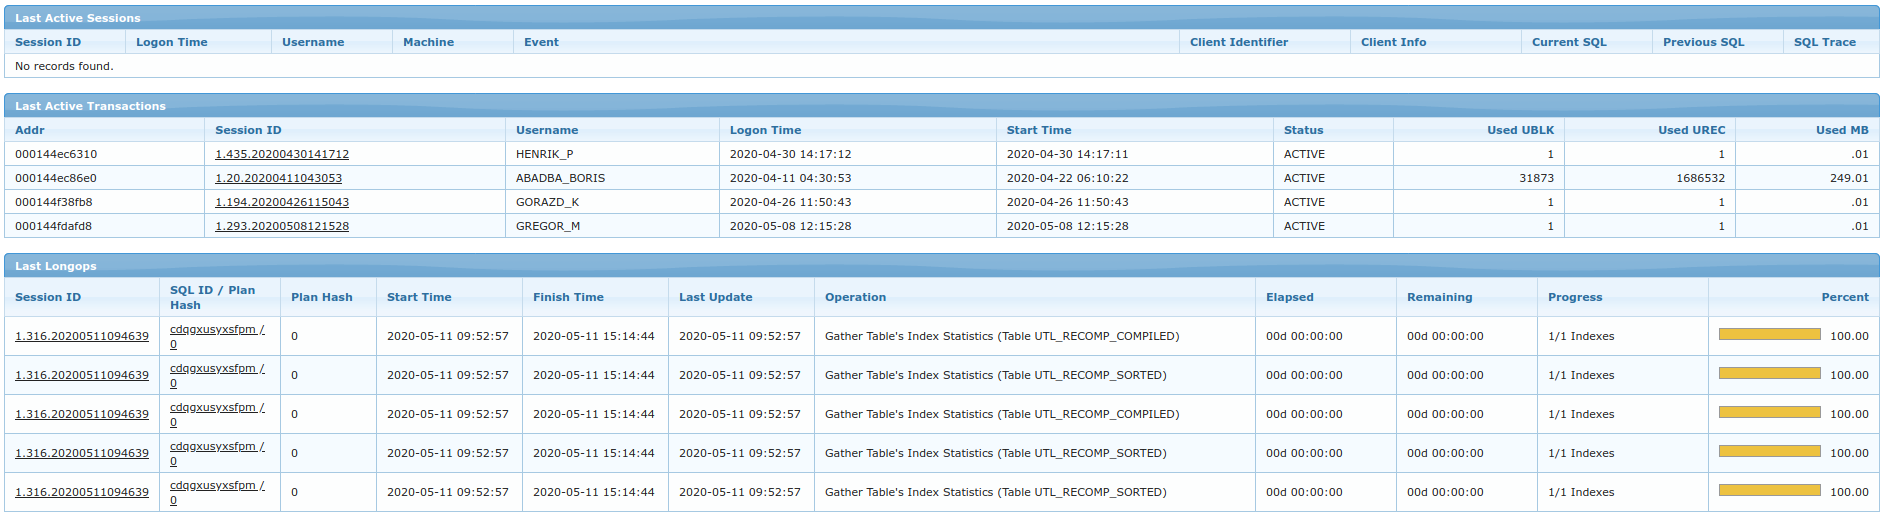
This section displays last non-aggreggated samples which were collected at time less or equal to To field.
@todo=[insert links] For definition of each column please refer to:
-
Sessions
-
Transactions
-
Longops
History → Blocked Sessions
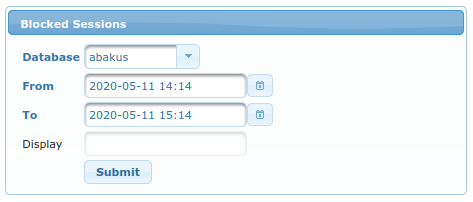
Form allows to select which Database to analyze in which period (From and To).
Chart
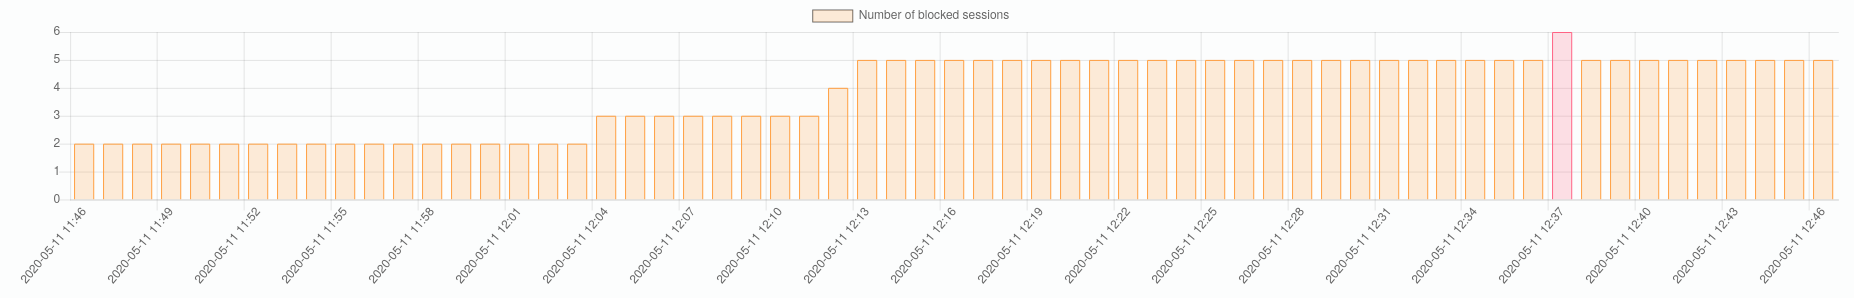
Chart displays amount of blocked sessions in selected period. One of the bars (the highest one) is of red colour - this means that the table bellow the chart refers to the same point-in-time as the red bar.
Tree Table of Blockers and Waiters

Treetable displays who was blocking who. The columns are as follows:
-
SID- Session ID (composed of <inst_id>.<sid>.<logon_time>) -
Status- Status of the session as reported byv$session.status -
Username- Username for this session -
Sec in Wait- Seconds in wait as reported byv$session.seconds_in_wait -
SQL- SQL that is currently being executed. You can click on it to see more details. -
Previous SQL- SQL that was executed before the current one. You can click on it to see more details. -
Event- Event which is being waited on. -
Owner- Schema owning the object that was locked and being waited on. -
Object Name- Name of the object that was locked and being waited on. -
Object Type- Type of the object that was locked and being waited on.
History → SQL Statements
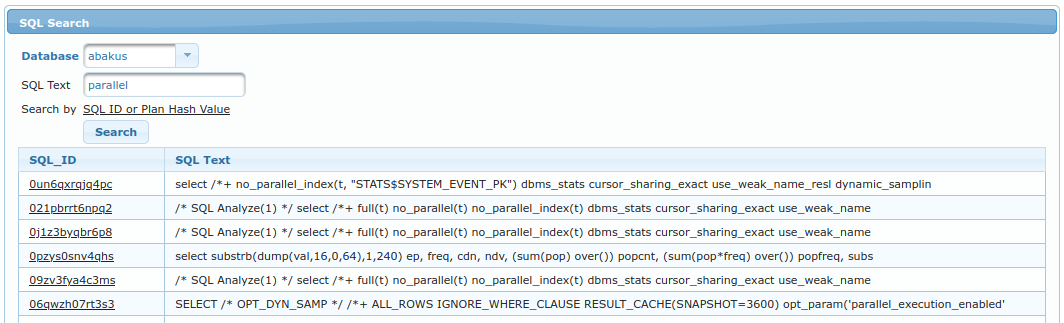
Allows you to find any SQL Statement whose sql_id was found among samples. You can either search by it’s SQL Text or
by it’s SQL ID (or plan hash value).
You can click on any sql_id found in the table to obtain more details which are explained in the next section.
SQL Detail
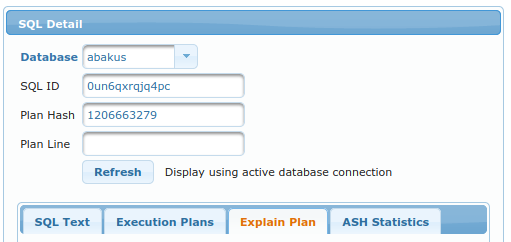
This view can be accessed by clicking on sql_id or plan_hash_value while being on any page under the History menu.
In order to display details for specific SQL, this form displays:
-
Database- in which database to look for specified sql_id -
SQL ID- for which sql_id to look for -
Plan Hash- (optional) display specific plan for this sql_id -
Plan Line- (optional) highligh specific line in plan table output.
Following tabs are available:
SQL Text
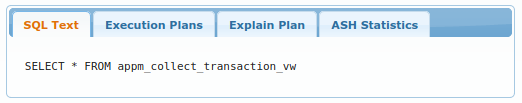
It simply displays SQL Text as seen in v$sql.sql_fulltext.
Execution Plans
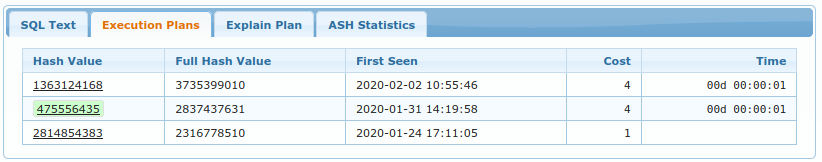
It displays list of all plan_hash_values, which were seen while executing this specific SQL. You can select any of them - currently selected one is colored green like the one on the screenshot.
Explain Plan
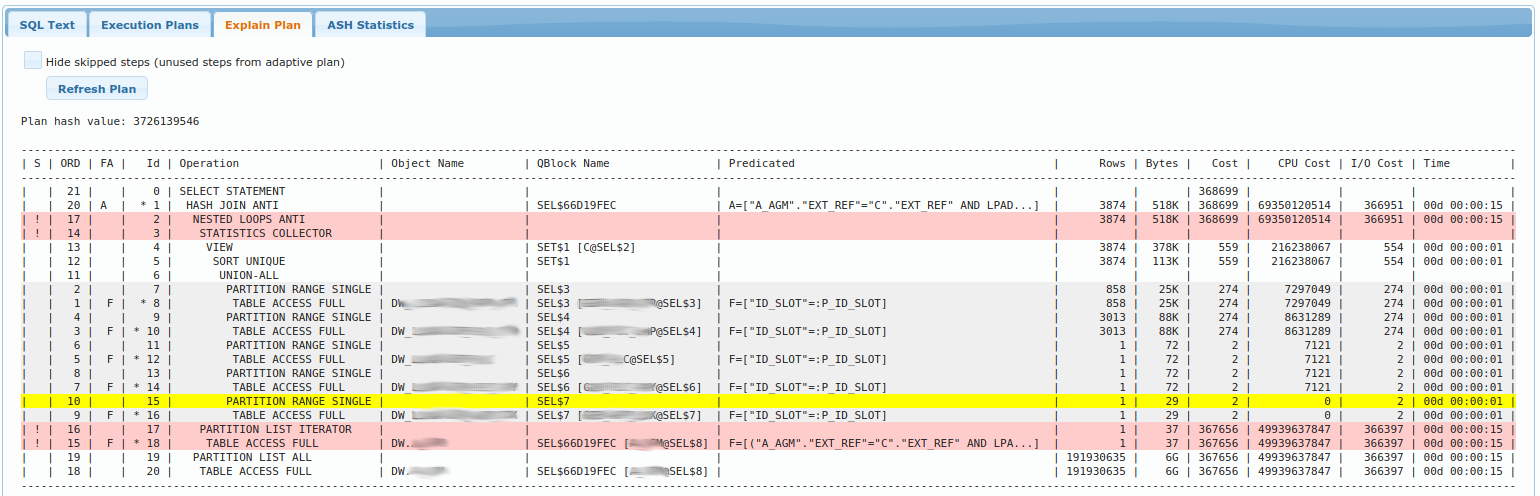
It displays table similar to what dbms_xplan.display() shows;
Yellow line is the line number as specified by Plan Line (to highlight currently executing line of query when
it is known - or it can be used to highlight arbitrary plan line).
Gray lines are those that were already executed (although they can be executed again).
Red lines are steps that were not used due to adaptive plan. You may choose to hide those steps entirely
by selecting Hide skipped steps.
White lines lines are yet to be executed (will be executed after the yellow line).
ASH Statistics
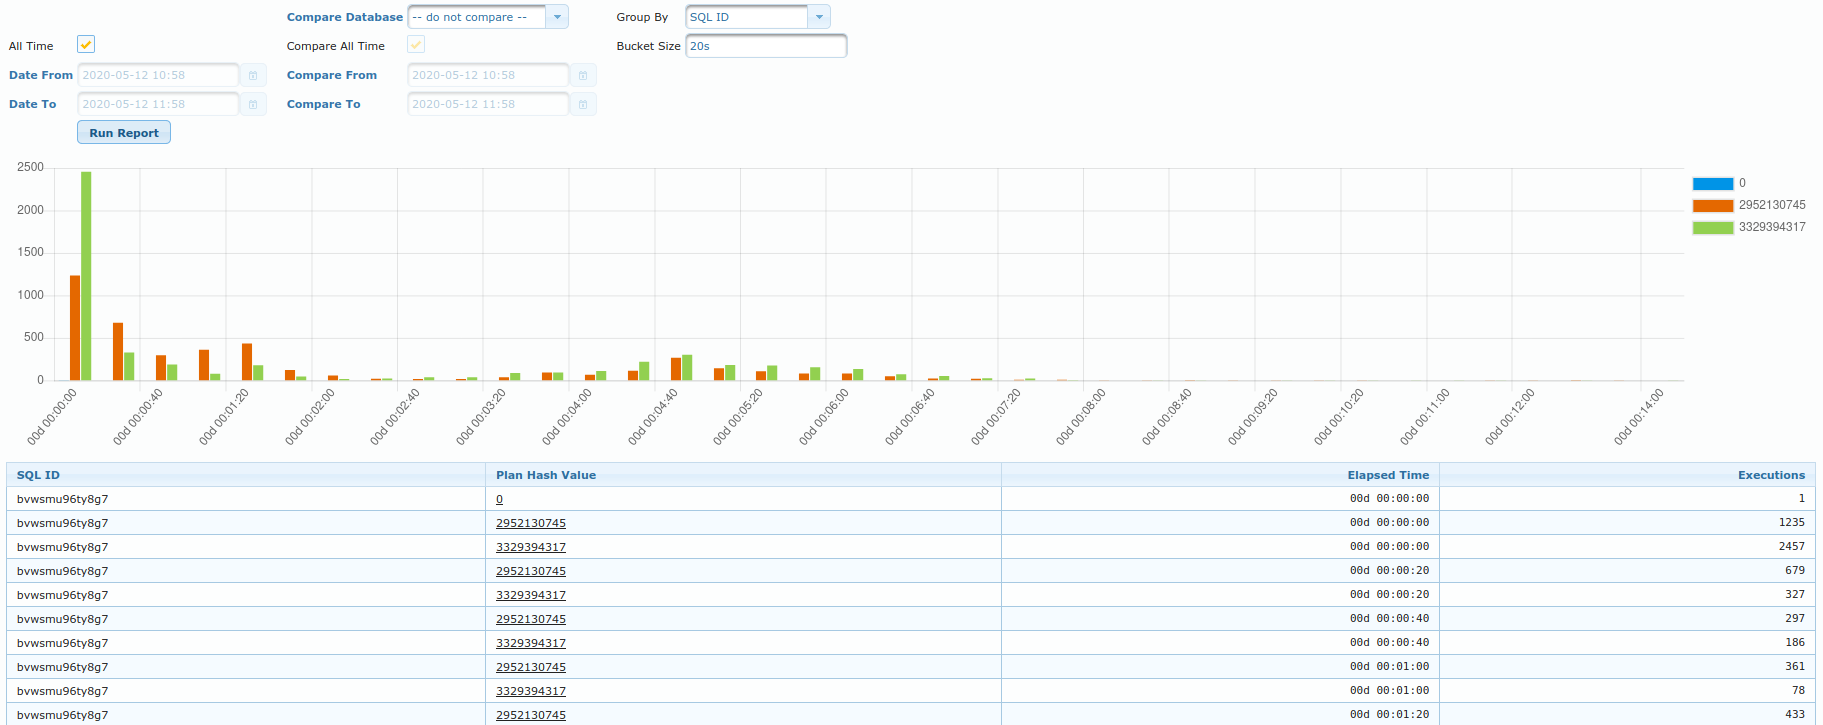
This view should provide insight into which plan (for specific sql) have performed better (faster) than the others. Of course, same plan can perform faster/slower at different times. And so, this view shows histogram of how fast was the plan executed.
e.g. in the chart above, "green" plan was executed 2500 times in under 20 seconds.
Table displays the same data in tabular format.
You can also utility Compare fields in order to compare execution times across different databases or
different periods.
Session Detail
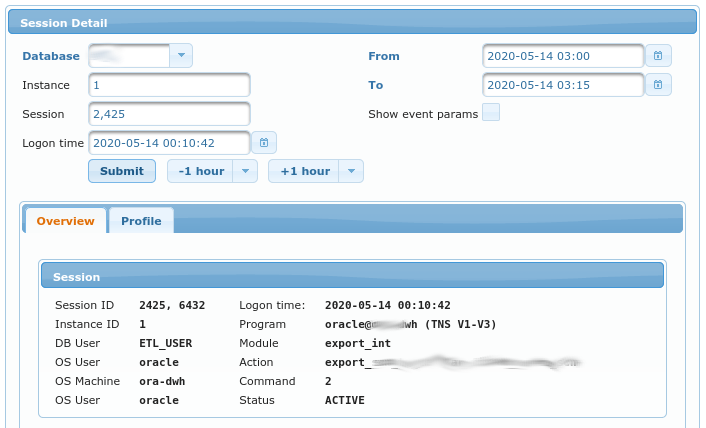
This view displays various info about specific session. Each session is uniquely identified by (fields of this form):
-
Database- which database it refers to -
Instance- instance on which the session was logged on (v$session.inst_id) -
Session- session id (this is unique only at specific point in time for specific instance). It refers tov$session.sid. -
Logon time- when the session logged on. It refers tov$session.logon_time
Additional parameters to this view are:
-
From- when the period for report of this view begins -
To- when the period for report of this view ends -
Show event params- whether or not to display event parameters inProfiletab.
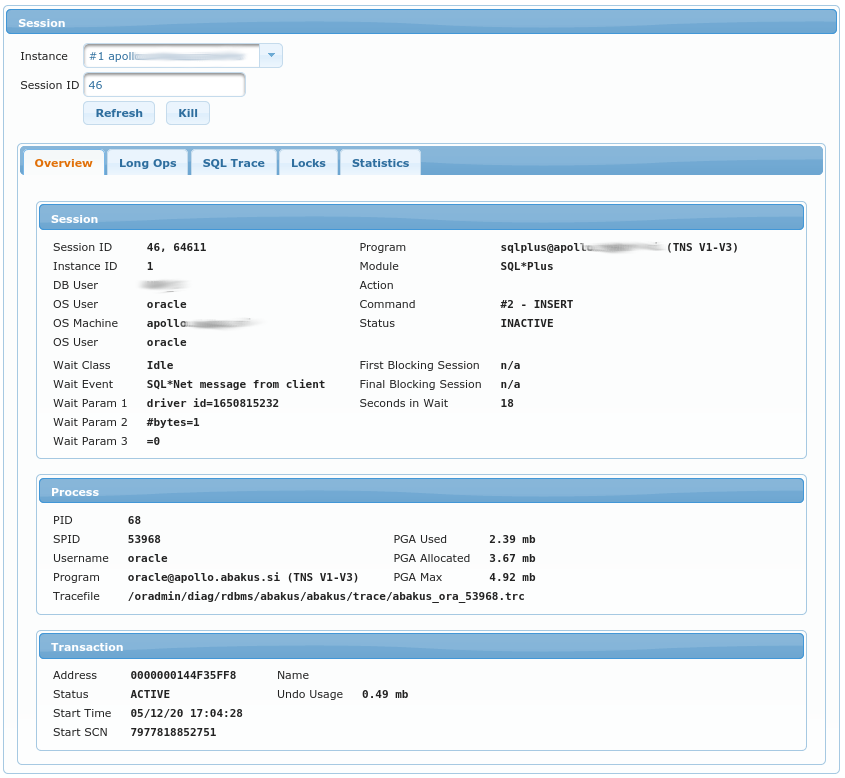
Overview
Session
This view display values from v$session
view. Fields are documented in official Oracle documentation.
Transactions
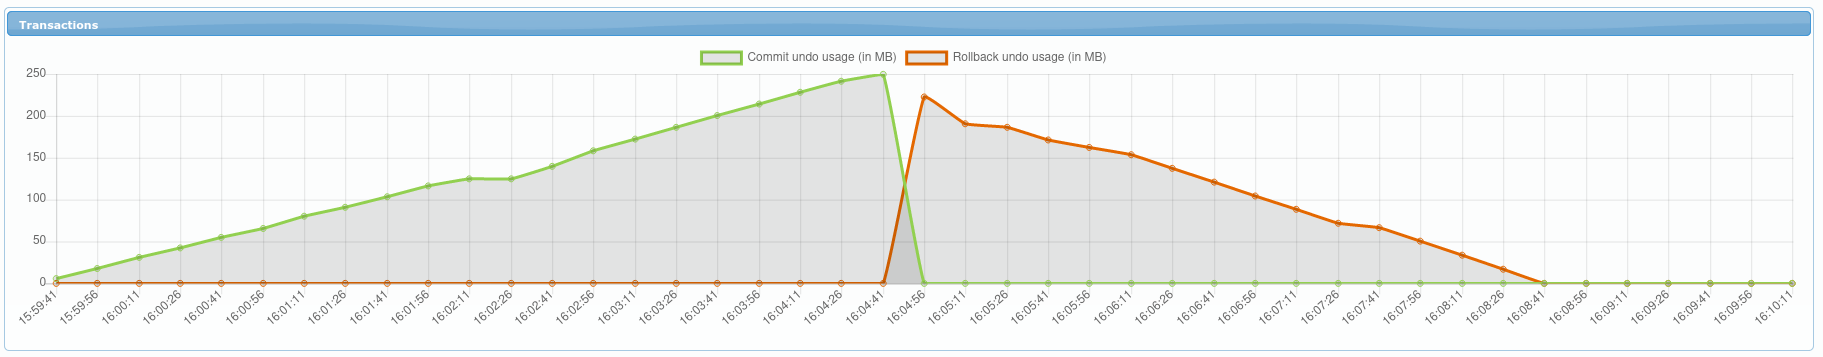
Chart displays amount of UNDO used. Green line shows amount of currently uncommited data. Orange line shows amount of UNDO used by transaction that is being rolled back.
Process
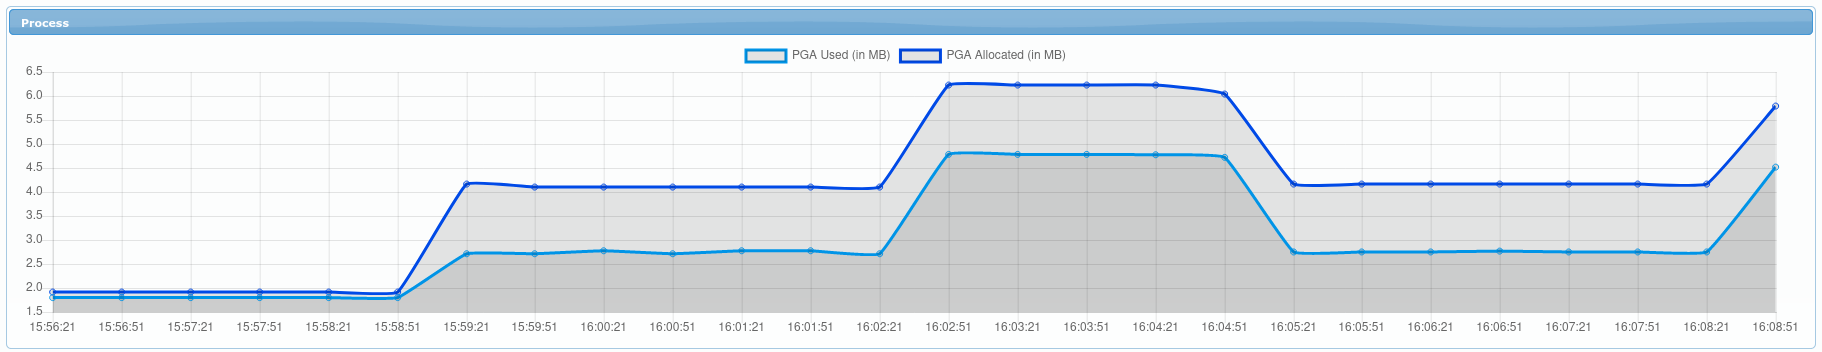
Chart displays PGA memory usage for this session’s process. Darker line shows allocated usage (in MB) and ligher line shows actually used PGA (in MB).
CPU
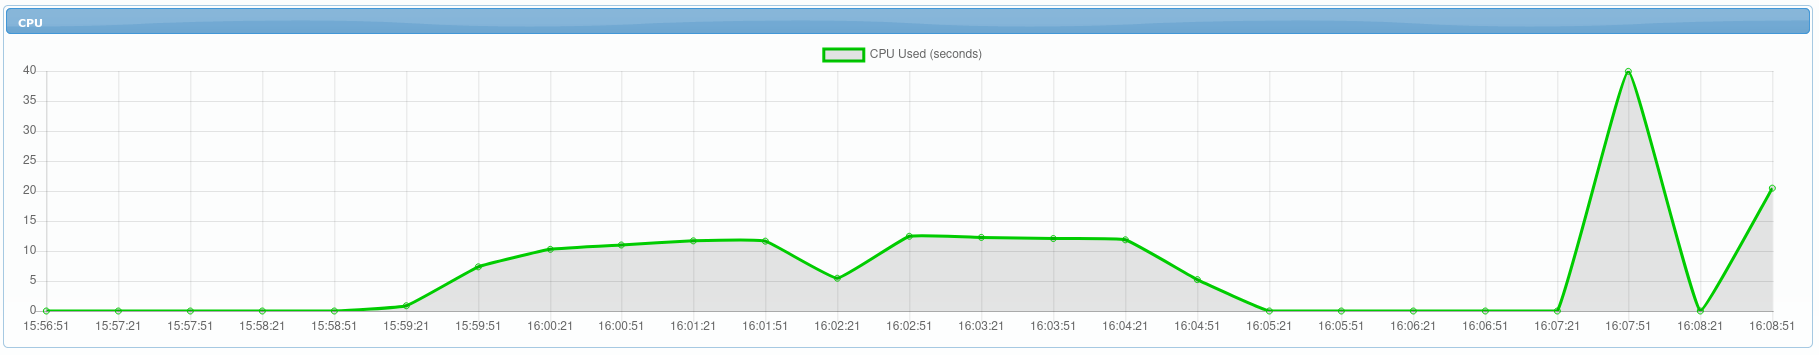
CPU Usage for this sessions’s process. This chart is available only for databases version 18c and higher, where
v$process.cpu_usage is available.
Profile
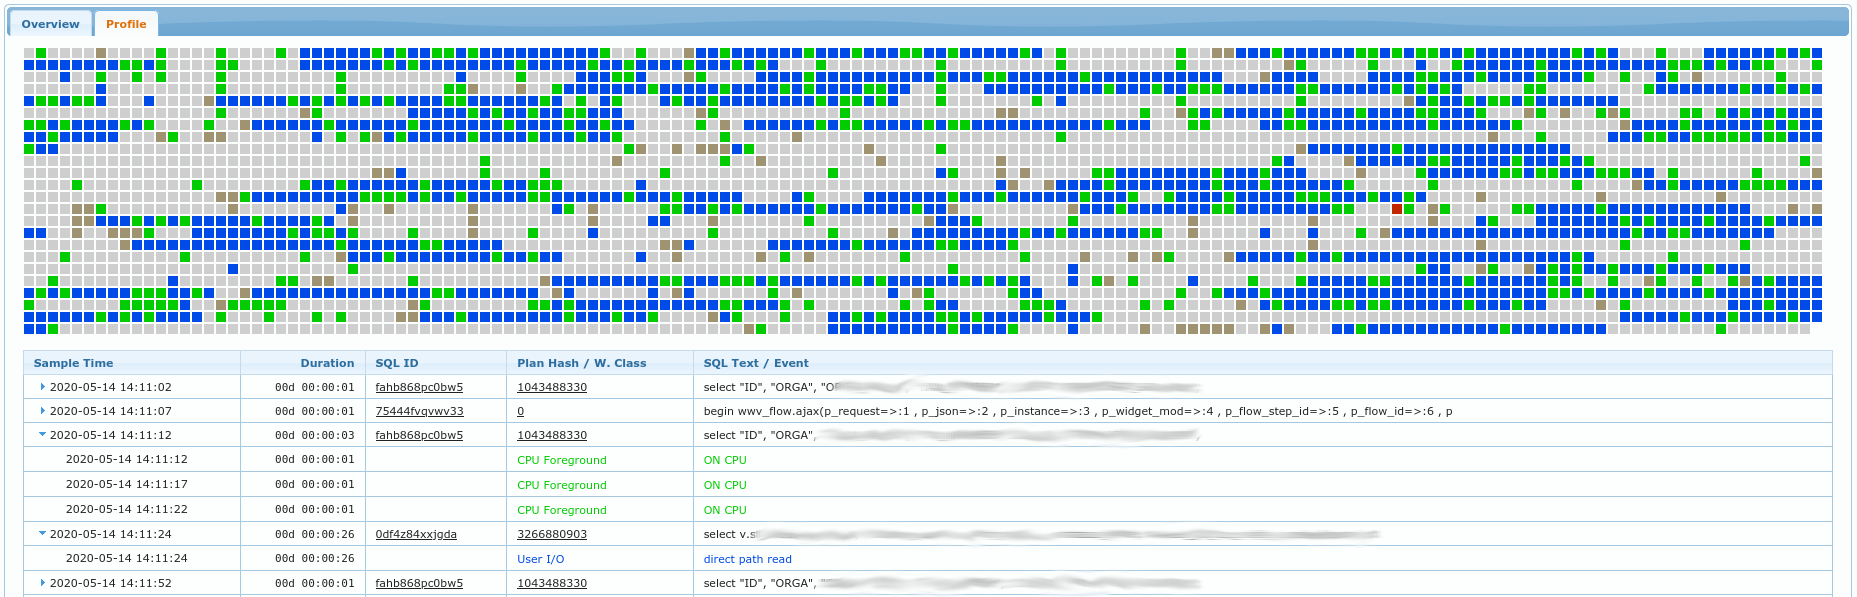
If selected period is ⇐ 2h, then chart with a lot of small squares is drawn. Each sqare represents 1 second of what session was doing. Gray squares represent idle times while all other colors represent on of the "Wait Class" colors. You can hover over any of the squares in order to obtain tooltip information what the session was waintin on on exactly that moment (which wait class and which event exactly).
Bellow the chart is table with contents somewhat similar to what SQL Trace would provide. It shows list of SQLs being executed by the session and list of events that were waited on for each of those SQLs. Color of event matches the color for a wait class.
You can get even more detailed info (added event parameters) in this table if you set checkbox Show event params to true.
Performance (using active connection)
Performance → Sessions
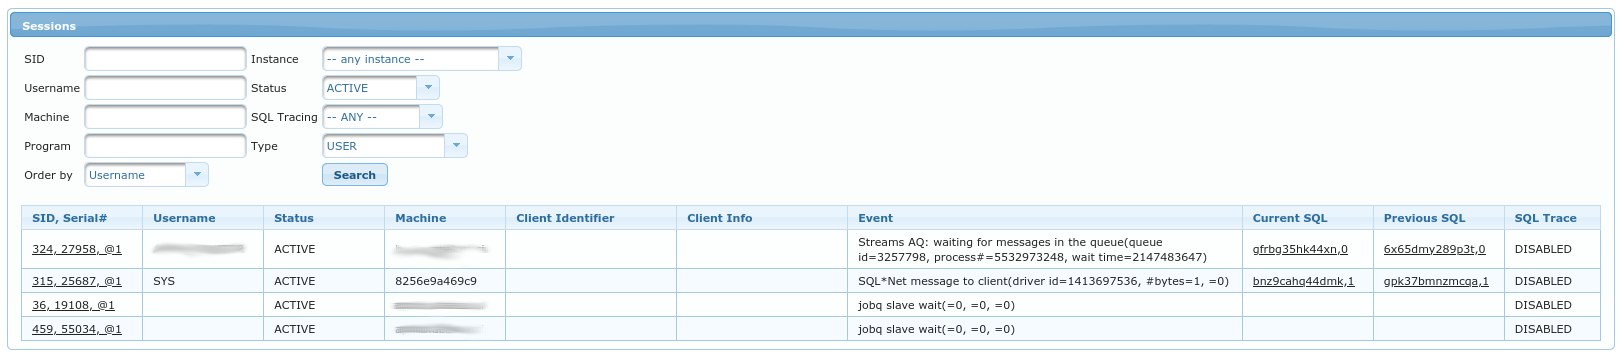
This view allows searching through v$session directly on the database that we’re connected to.
If you simply click Search without changing any criteria it will show all currently ACTIVE sessions.
You can of course search the sessions using provided form:
-
SID- by session ID (v$session.sid) -
Username- by username (v$session.username) -
Machine- by machine (v$session.machine) -
Program- by program (v$sessionn.program) -
Instance- by instance id (v$session.inst_id) -
Status- whether to only search among currently [in]active sessions. -
SQL Tracing- whether to only search the sessions that have SQL Tracing enabled or disabled. -
Type- by type (v$session.type)
The table bellow displays results of your query. It contains columns from v$session - those columns are explained
in official Oracle documentation at:
Note that columns SID, Serial#, Current SQL and Previous SQL contain links to session or SQL details.
@todo: link to Session Detail…
Performance → Transactions
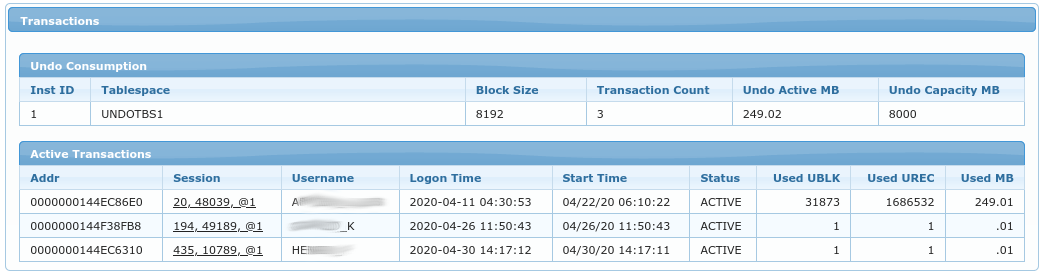
Undo Consumption part display info about UNDO tablespaces and their usage. Data comes from
dba_data_files and
gv$transaction views.
Active Transactions display list of currently active transactions as available from
gv$transaction.
Performance → Memory
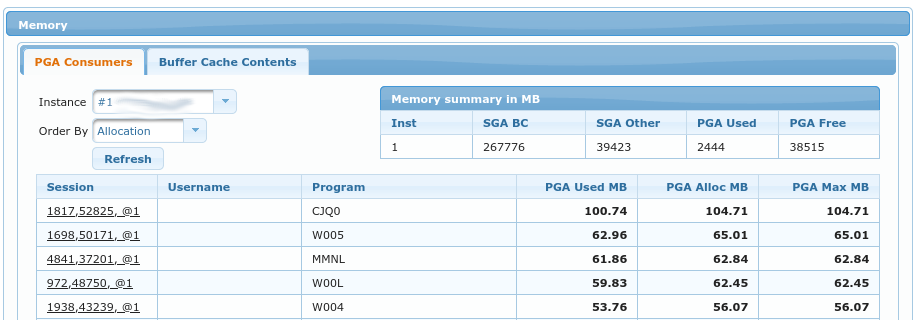
Memory Summary displays how much memory is dedicated to PGA and SGA (in megabytes):
-
Inst- instance id for which data is displayed -
SGA BC- amount of memory dedicated to Buffer Cache -
SGA Other- amount of memory dedicated to all other parts of SGA -
PGA Used- amount of PGA memory used -
PGA Free- amount of PGA memory free
Table bellow displays amount of PGA memory occupied by session
-
Session- session id for which the data is displayed. It contains a link to session details. -
Username- database username for this session -
Program- program name for session -
PGA Used MB- amount pf PGA currently used -
PGA Alloc MB- amount of PGA memory currently allocated -
PGA Max MB- amount of PGA memory allocated at the peak point of the session.
Buffer Cache Contents
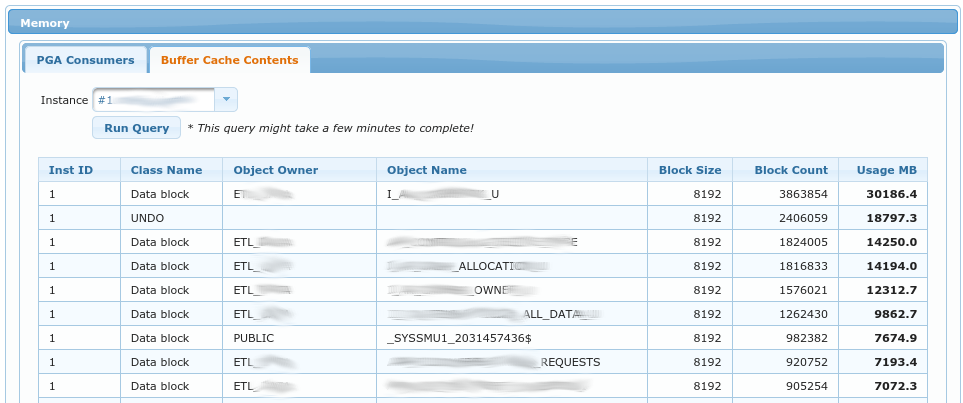
This view displays contents of Buffer Cache. It is based on
gv$bh view.
-
Inst ID- instance ID for which data is displayed -
Class Name- Name of class (type/what is cached) -
Object Owner- Owner of the table/object which is cached -
Object Name- Name of the table/object which is cached -
Block Size- Block size of the tablespace for the segment of this table/object -
Block Count- Amount of blocks cached -
Usage MB- amount of MB cached for this object
Performance → Blocked Sessions
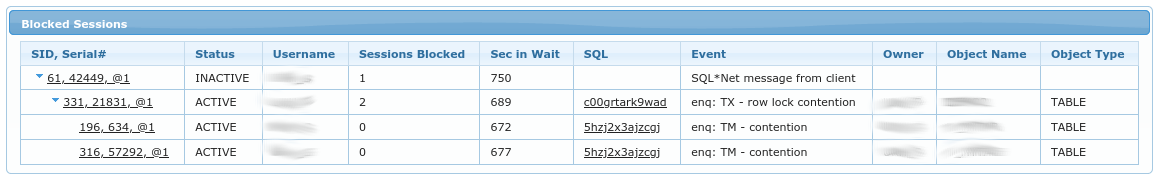
This view displays a tree table of all blocked sessions. Blockers are parent nodes and waiters are child nodes.
-
SID, Serial#- session id of blocker/waiter; it also contains a link which opens session details for this session. -
Status- column fromv$session.status; it shows if the session is active or not -
Username- username for this database session -
Sessions Blocked- amount of sessions being blocked by this session -
Sec in Wait- column fromv$session.seconds_in_wait- number of seconds waiting for the current event. -
SQL- which SQL is currently being executed by this session. It also contains a link which opens SQL Details for this session. -
Event- event on which the session is currently wainting. -
Owner- owner of object for which the session is trying to obtain the lock -
Object Name- name of the object for which the session is trying to obtain the lock -
Object Type- type of the object for which the session is trying to obtain the lock
Performance → Locked Objects
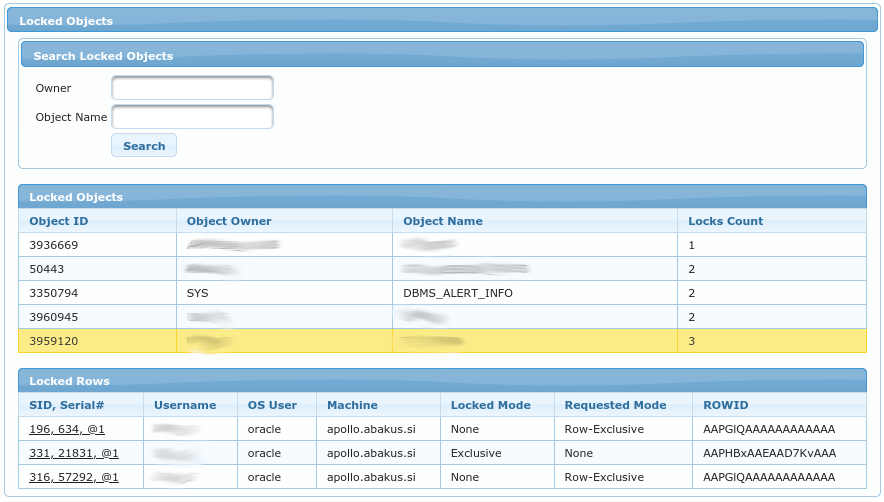
Search Locked Objects
Form allows searching for specific objects.
-
Owner- owner of the object that is being searched for. -
Object Name- name of the object that is being searched for.
Both fields are using LIKE operator, so you can use % as a wildcard.
Locked Objects
Table displays list of locked objects (according to filter in the form above).
-
Object ID- ID as specified indba_objects.object_id -
Object Owner- owner of the locked object -
Object Name- name of the locked object -
Locks Count- amount of locks that are held on this object
You can select any of the rows to refresh the child table Locked Rows.
Locked Rows
This is a child table of Locked Objects above. It displays list of rows locked in selected table (if object
is a table).
-
SID, Serial#- session id of the session that hold the lock -
Username- lock holder username -
OS User- OS username of lock holder (refers tov$session.os_usercolumn) -
Machine- Machine of lock holder (refers tov$session.machinecolumn) -
Locked Mode- In what mode the lock is acquired -
Requested Mode- In what mode the lock is requested, but not yet acquired -
ROWID- of the row being locked (when available and when appropriate for the lock type)
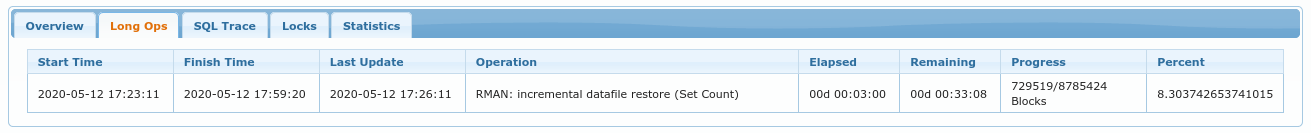
Performance → Long Ops

This view is based on v$session_longops
and it shows progress of long running operations.
-
SID, Serial#- Identifier of the session processing the long-running operation. If multiple sessions are cooperating in the long-running operation, then SID corresponds to the main or master session. -
Start Time- Starting time of the operation -
Finish Time- Estimated finish time -
Last Update- Time when statistics were last updated for the operation -
Operation- Brief description of the operation -
Elapsed- Amount of elapsed time from the start of the operation -
Remaining- Amount of time estimated to the end of the operation -
Progress-SOFAR/TOTALWORKUNITSfrom v$session_longops. -
Percent- amount of work completed in percents.
Performance → Statspack
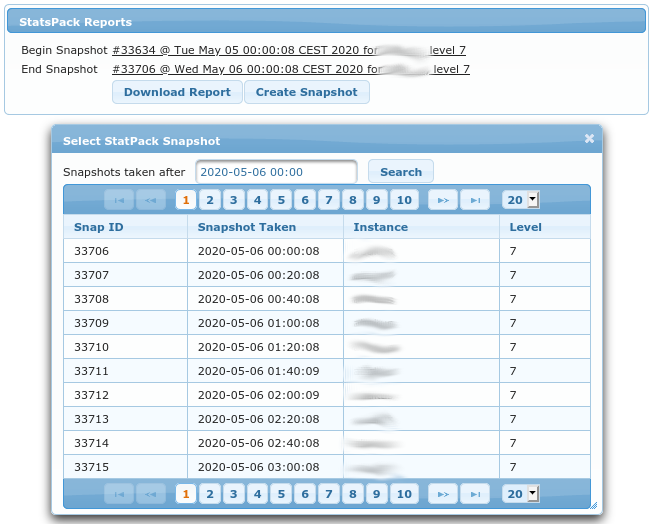
This view allows you to manually create new statspack snapshot (by clicking Create Snapshot button) and
to generate Statspack Report. Report is generated by selecting two snapshots to compare, you can
select them by clicking on labels besides Begin Snapshot and `End Snapshot.
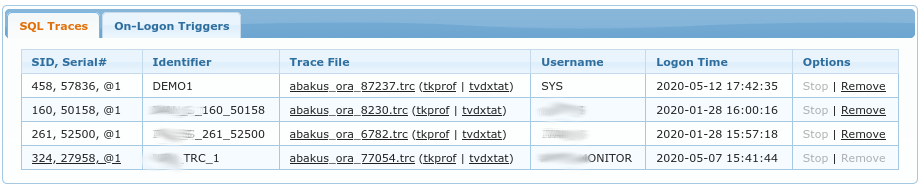
Performance → SQL Trace
|
Important
|
You can start tracing any session in Session Detail view. (@todo: link).
|
SQL Traces lists all of the trace files created by APPM. It allows you to Stop currently active trace
and to Remove obsolete trace files. Note that you can only Remove those trace files for which session
has already ended (trace file of an active session cannot be deleted through APPM).
You can download raw trace files by clicking on their name such as dbname_ora_<pid>.trc or you can
download aggregated reports based on those trace files. Two such options exists:
On-Logon Triggers
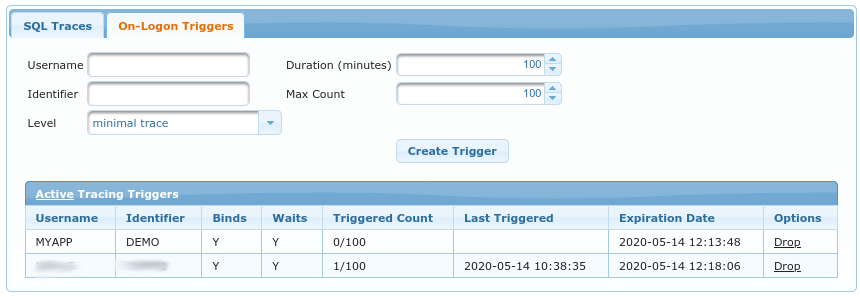
For tracing short-lived sessions or things that happen right after the logon, there is an option to create
ON LOGON TRIGGER which automatically starts the SQL trace. Following options are available when creating
such trigger:
-
Username- Oracle schema/username which will be traced after logon -
Duration (minutes)- Drop logon trigger after this many minutes have passed (thus making sure we don’t create such trigger and forget about it) -
Identifier- tracefile identifier, this is prefix for the trace filename. It is also alias for those traces in this GUI (see previous chapter) -
Max Count- number of logons to trace, after this many logons the logon trigger is dropped (thus making sure we don’t flood the system with too many trace files) -
Level- how much detail do we need; it determines whether or not do we need bind variables and wait events present in the trace files.
Table under Active Tracing Triggers displays list of currently active triggers and allows you to immediately
drop the specific trigger if necessary.
Performance → SQL Patch
|
Important
|
You can create new SQL Patch in SQL Details view (@todo: link). |
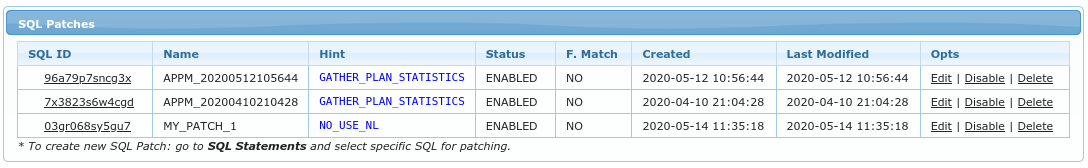
This page lists all SQL Patches.
Columns of the table are as follows:
-
SQL ID- SQL ID of the statement for which the patch was created. If patch was created manually (without APPM), then this column displays SQL signature number. Editing of such manually created patch is not possible. -
Name- User defined (or auto generated) name of SQL Patch. This is unique among all SQL patches. -
Hint- Hints that are applied using this patch. Those written in blue color are valid hint names and those in red color have syntax error. -
Status- Tells if this patch is enabled or disabled. Only one SQL Patch may be enabled at a time. (Note to advanced user: only one patch per group may be active, but APPM only operates in DEFAULT group). -
F. Match- If force matching is used. -
Created- Date when the patch was created. -
Last Modified- Date when the patch was last modified. -
Opts- You may enable/disable or delete or edit any patch listed.
Performance → SQL Statements
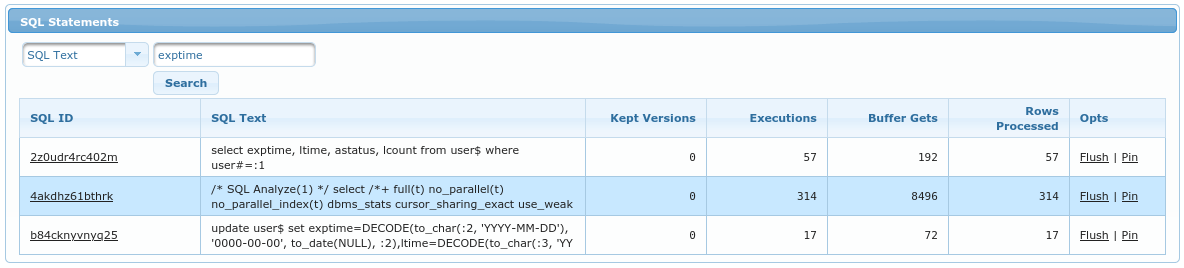
This page allows searching through all SQL Statements which are in SGA. It allows searching by:
-
SQL Text- any part of sql text. Note that whatever you enter has appended and prepended%(forLIKEoperator) -
SQL ID- bysql_id -
Hash Value- byplan_hash_value -
Pinned Only- display only the SQLs that are currently pinned in memory
Results table has following columns:
-
SQL ID- sql_id; it contains a link toSQL Detail(@todo: link). -
SQL Text- first part of sql text (if it is too long). You can put cursor on the text and wait second - tooltext shold pop up and display complete SQL. -
Kept Versions- Amount of cursors kept in memory -
Executions- Number of executions since last hard parse -
Buffer Gets- Amount of buffer gets since last hard parse -
Rows Processed- Amount of rows processed since last hard parse -
Opts- There are two options:flush(which will cause this sql_id to be flushed from SGA and thus require hard parse on next execution) andpin(to make sure that sql_id won’t age out of memory).
Performance → Alert Log
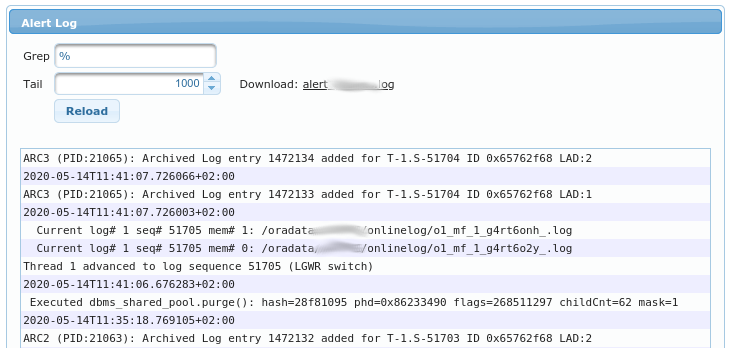
The page displays contents of alert log. It also allows to download the complete alert log.
-
Grep- allows to filter alert log for specific lines, e.g.ORA-00600% -
Tail- amount of last lines to display bellow
Note that this way application developers can access the alert log without ssh/rdp access to the database server.
SQL Detail
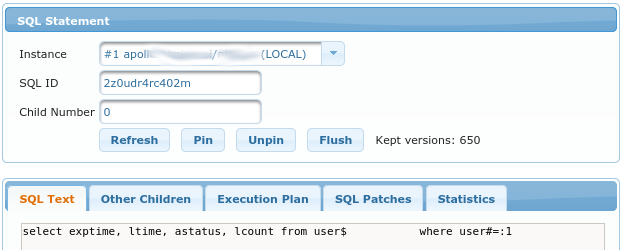
SQL Details are displayed for SQL identified by:
-
Instance- this isinst_id -
SQL ID- this identifies the SQL -
Child Number- specific child number, can be0if child is not known
SQL Text
displays complete SQL Text for selected sql_id.
Other Children
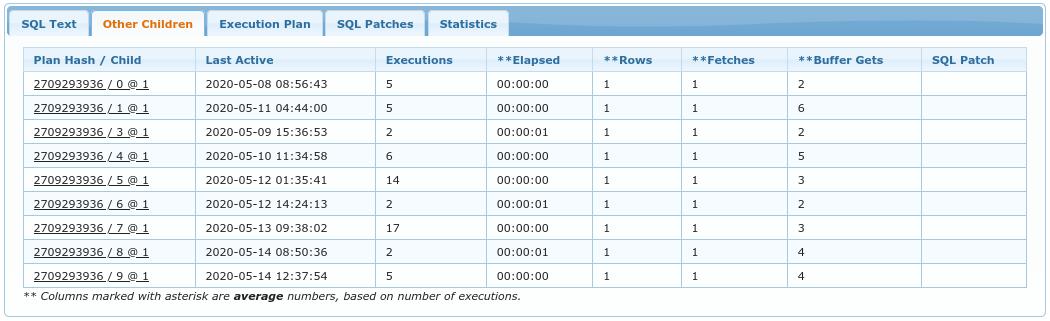
This tab displays list of all known SQL Plans. This is basically list of plans from v$sql.
If child number was known when the dialog was open, then this child number is highlighted with green color as seen on the screenshot.
Columns are as following:
-
Plan Hash / Child- Plan hash is numeric representation of the current SQL plan for this cursor. Comparing one PLAN_HASH_VALUE to another easily identifies whether or not two plans are the same (rather than comparing the two plans line by line). Child instance is number of child cursor. -
Last Active- Time at which the query plan was last active. -
Executions- Number of executions that took place on this object since it was brought into the library cache. -
**Elapsed- Elapsed time used by this cursor for parsing, executing, and fetching. If the cursor uses parallel execution, then ELAPSED_TIME is the cumulative time for the query coordinator, plus all parallel query slave processes. This value is divided by number of executions. -
**Rows- Total number of rows the parsed SQL statement returned. This value is divided by number of executions. -
**Fetches- Number of fetches associated with the SQL statement. This valid is divided by number of executions. -
**Buffer Gets- Number of buffer gets for this child cursor. This value is divided by number of executions. -
SQL Patch- Name of SQL Patch used to produce this plan, if any.
Execution Plan
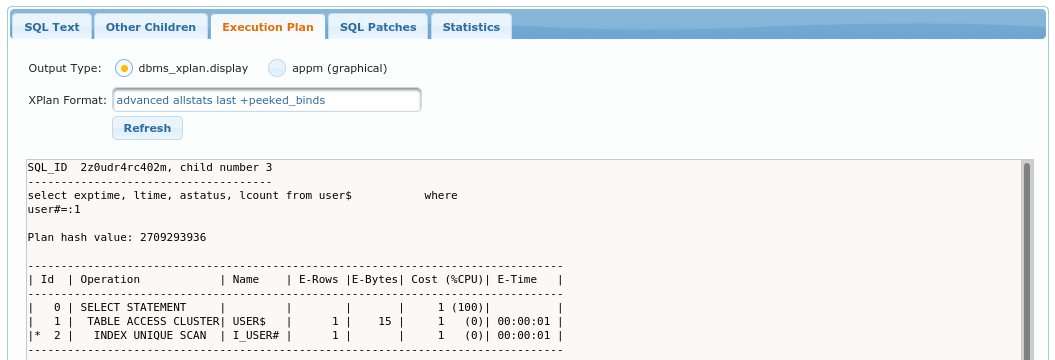
This tab display execution plan for selected child number. Plan is displayed either with dbms_xplan or graphically
if Output Type is selected to be appm (graphical).
XPlan Format determines options passed directly to dbms_xplan.
SQL Patches
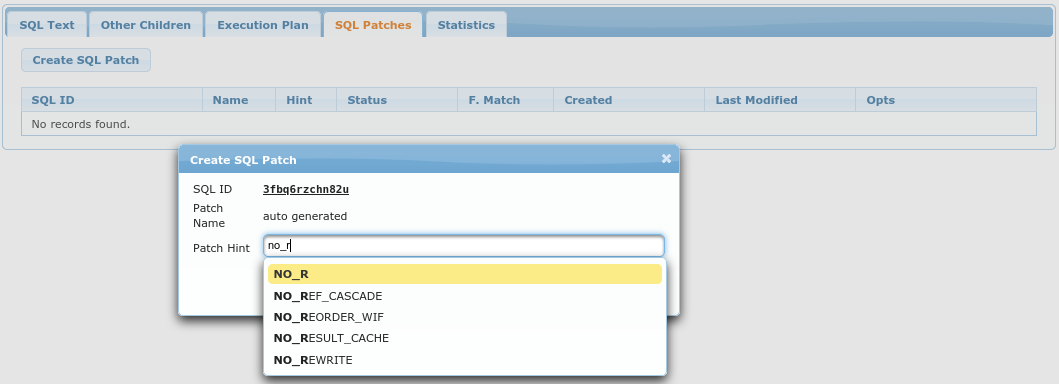
This is where you can create new SQL Patch for selected sql_id.
List of all SQL Patches (for all sql_ids ) is also available at Performance → SQL Patches (@todo: link).
Columns of this table are also explained under Performance → SQL Patches.
Create SQL Patch opens up the dialog in which you can enter:
-
Patch Name- optionally, it is auto-generated if you don’t enter it -
Patch Hint- actual hint to apply to givensql_id. -
Enable block input- is used to display textarea where you can paste Outline Data from plan (or specify a bunch of hints manually).
Note that after you click Create SQL Patch the sql is automatically flushed from SGA because we want it to
be hard parsed next time it executes. This also means that after creating a Patch this view won’t be able
to display any data regarding given sql_id, because it is not available anymore (until the next execution).
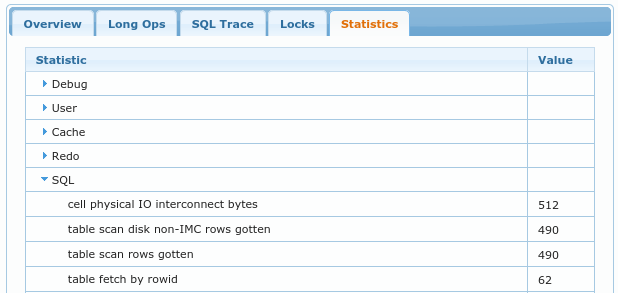
Statistics
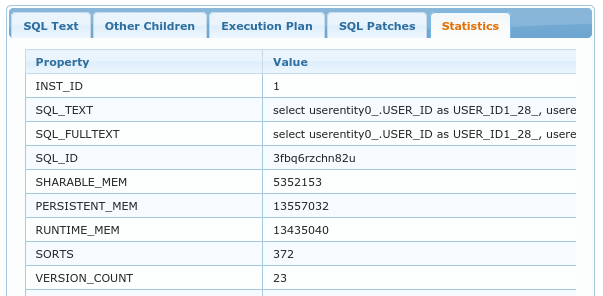
This tab displays all columns from v$sqlarea for given sql_id.
Session Detail
Session view displays session details based on Instance and Session ID (those two fields refer to gv$session.inst_id and
v$session.sid).
Under Overview tab, there are columns from:
Longops
The table displays longops for this session. Columns are as documented in the official Oracle documentation:
v$session_longops
SQL Trace
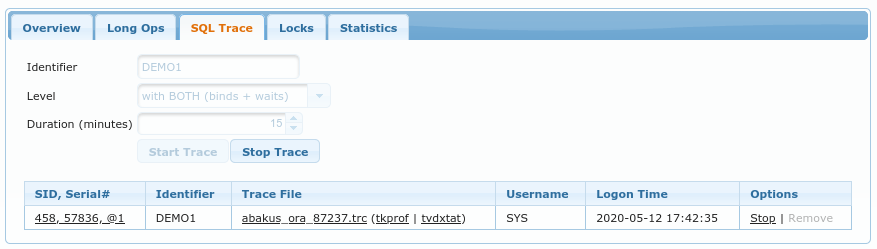
Here you can enable SQL Trace-ing for selected session.
-
Identifieris the name for APPM so that you can later find trace files according to those identifiers. -
Levelis the level for SQL Trace, you can trace with or without bind variables and waits (or with both) - the more details that you require, the bigger the trace files becomes :) -
Durationstops SQL Trace after this amount of minutes. This option here is because we don’t want to enable tracing and then forget that we enabled it.
Note that tracing a session might have performance implications on the traced session.
The table lists all the trace files that are available for this session.
You can either download raw trace file or send it through tkprof or tvdxtat (those
are both tools that allow you to create aggregated report from raw trace files).
You can also Stop tracing or Remove the trace file. Note
that you cannot remove a trace file of a running session - this is why
most of the time this Remove option is grayed-out.
All the available trace files (even for sessions that no longer exist)
are available in Performance → SQL Trace view.
@todo: insert link to SQL Trace documentation
Locks
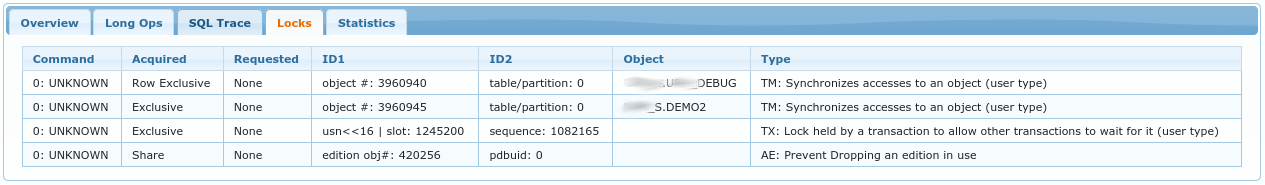
This tab displays list of all the locks that this session is holding. Data displayed is based
on v$lock performance view.
Columns in the table are:
-
Commandis the type of command that session is currently executing -
Acquiredis the lock type that is currently acquired -
Requestedis the lock type that is being requested (waited on) -
ID1this column also displays comment of what this id is, e.g.object # -
ID2this column also displays comment of what this id is, e.g.table/partition. -
ObjectifID1orID2are referencing object fromdba_objectsthen this column shows what object is being referenced. -
Typewhat kind of lock this is, column also includes comment about the type.
Storage (using active connection)
Storage → ASM Diskgroups & Disks
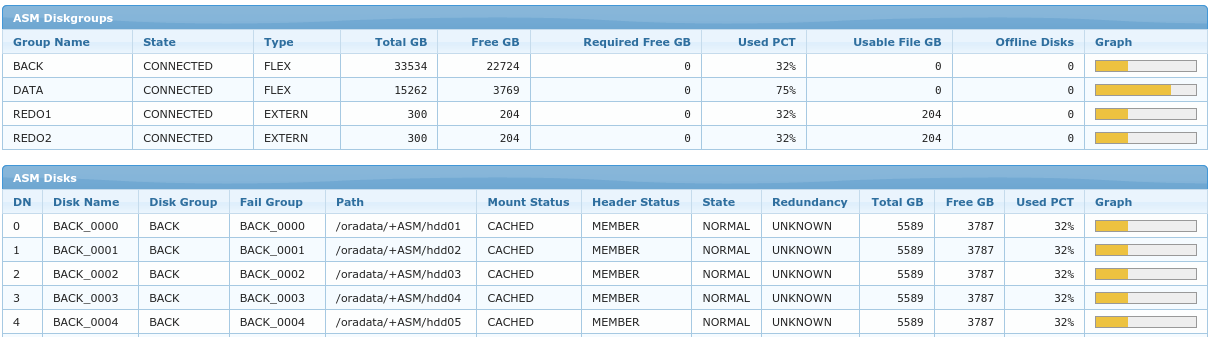
First table displays all ASM Disk Groups used by this database and the second one displays
all the ASM Disks used in those Disk Groups.
Report is based on the following two performance views:
Storage → Tablespaces & Datafiles
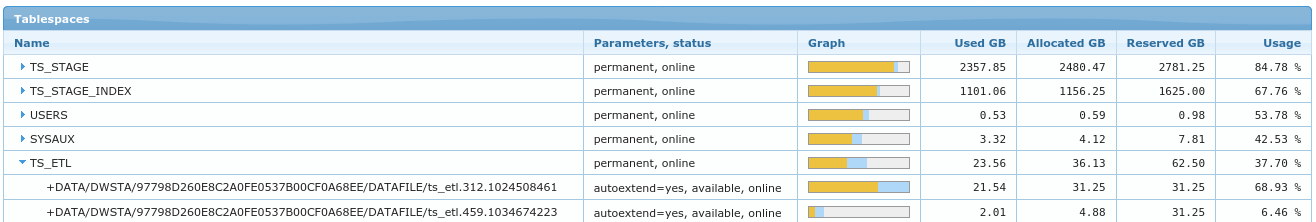
This table displays list of all Tablespaces and their datafiles. Columns are:
-
Name- name of the tablespace or path to specific datafile -
Parameters, status- type of tablespace and info about autoextend for specific datafile -
Graph- yellow color means used space, blue means allocated space and light-gray is all the reserved space. -
Used GB- amount of space occupied by segments -
Allocated GB- amount of space allocated by datafiles (this much of disk space is used from OS perspective) -
Reserved GB- amount of space available according to autoextend attribute -
Usage- in percent, how much space is used (available space is considered to beReserved GB)
Storage → Redo Groups & Files
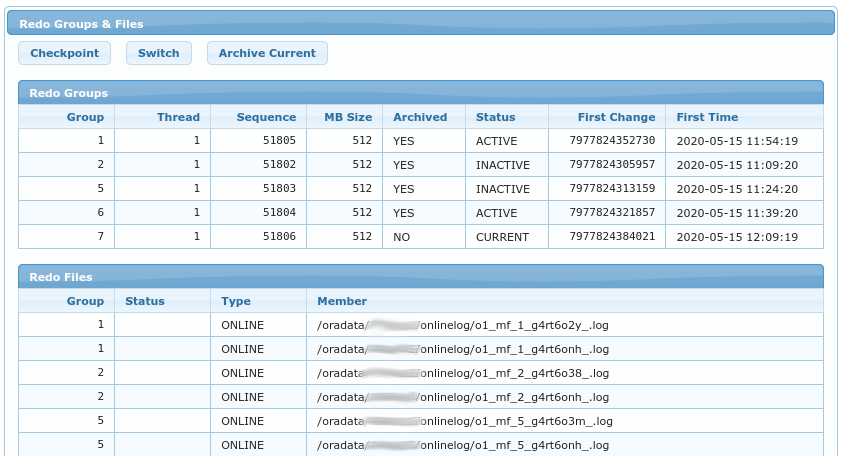
Buttons at the top are only available to SYSDBA users. They perform the following actions:
-
Checkpoint- Performs checkpoint ("dirty" buffers are flushed to datafiles) -
Switch- Current log group is advanced to the next one -
Archive Current- Same as switch, but also archive the current one immediately.
Storage → Control Files
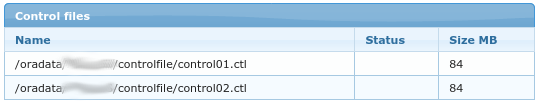
Displays list of all control files - with their status and size in MB.
Management
Database → Users
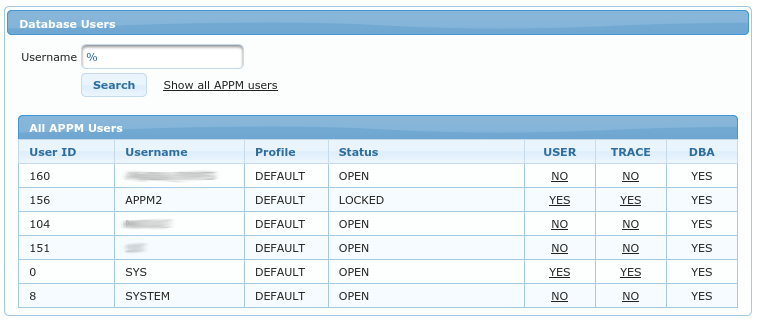
On this page you can define which Oracle users have access to database via APPM. From DBA perspecitve, APPM uses following database roles:
-
APPM_USER_ROLE- allows to query performance-related data through APPM application. It does not allow to change any data or to perform any actions on database (e.g. killing or tracing database sessions) -
APPM_TRACE_ROLE- allows everything that APPM_USER_ROLE allows and also adds privilege to perform SQL Trace of any session. -
DBAorSYSDBA- user can also perform some critical actions through APPM (such as killing database sessions).
Table in screenshot shows list of database users. By clicking on columns USER and TRACE you can grant/revoke previoulsy
described APPM_USER_ROLE and APPM_TRACE_ROLE. You cannot grant DBA or SYSDBA through GUI.
Table is displaying data from
dba_users view.
Repository → Users
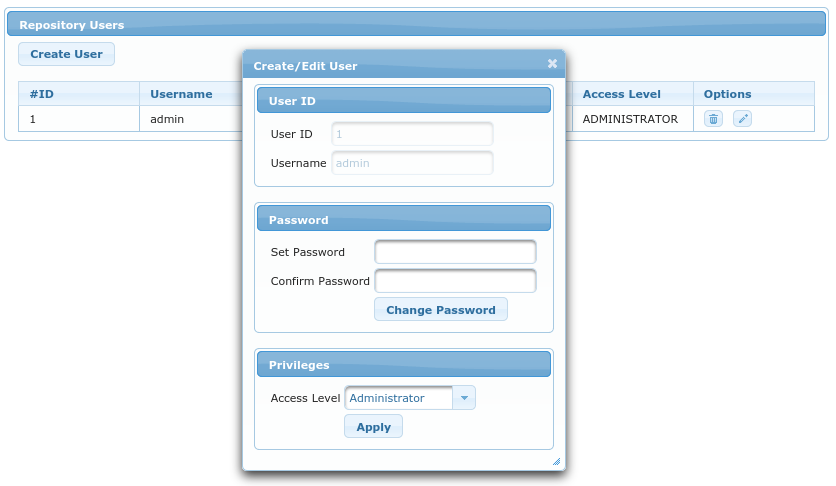
Repository users have access to APPM application and can query all sampled data. They cannot (without additional Oracle users as described in previous chapter) connnect to running Oracle instances.
There are two access levels:
-
Users- can query anything in a repository (but cannot make any changes) -
Administrators- can also register new databases (or edit existing ones) and add/modify Repository Users
Repository → Databases
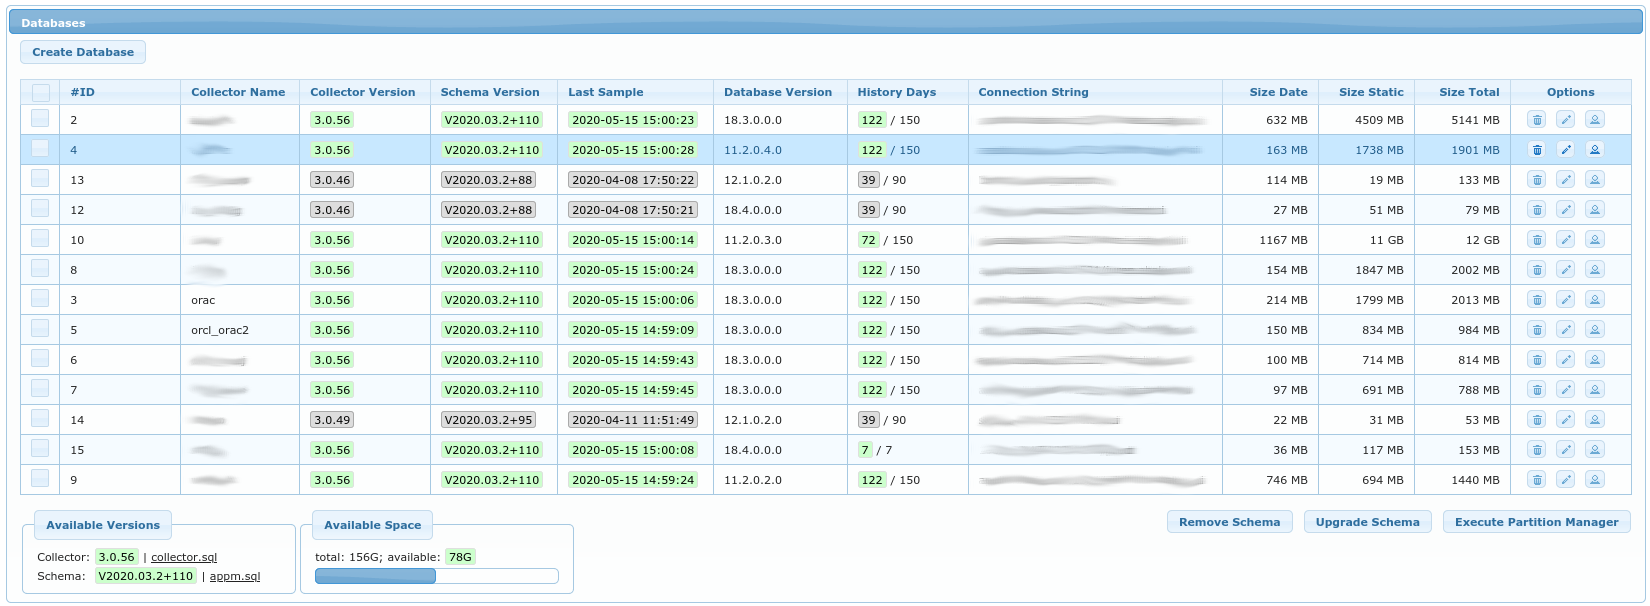
This is a list of all registered databases for which the APPM can receive samples (from APPM Collector, see Installation Guide on how to configure collector).
Each registered Oracle database can have following APPM relates schemas installed:
* APPM2 schema (can be named differently) holds packages and views used by APPM application. This schema is (and should be) LOCKED.
* APPM_COLLECTOR user (can be named differently) can connect to database and query only specific view in APPM2 schema, through which it obtains performance samples.
Following buttons are available:
-
Create Database- opens a popup to enter details for new database -
Remove Schema- removesAPPM2schema from Oracle Database. Popup will ask forSYSDBApassword in order to do that. -
Upgrade Schema- upgradesAPPM2schema on selected Oracle Databases. Popup will as forSYSDBApassword in order to do that. -
Execute Partition Manager- This is done automatically once per day. You can execute it on demand by using this button. It removes obsolete data and creates partitions until today + 3 days.
Note that following two links also exist if you are not keen on entering SYSDBA password into application:
-
collector.sql- creates/upgradesAPPM_COLLECTORschema on Oracle database if run assqlplus / as sysdba @collector.sql -
appm.sql- creates/upgradesAPPM2schema on Oracle database if run assqlplus / as sysdba @appm.sql
For each database, following parameters are stored:
-
Database ID- autogenerated numerical id for each database -
Collector Name- unique name of database (APPM Collector refers to this name in itscollector.ini) -
Collector Enabled- flag to know which databases are not meant to recieve any more samples (e.g. obsolete databases) -
Repository Schema- name of PostgreSQL schema which contains samples for this database -
Repository Tablespace- name of PostgreSQL tablespace which contains samples for this database -
Connection String- Oracle connection string in form ofhostname:port/service_name -
APPM Schema- Oracle schema name, usually namedAPPM2 -
History Days- For how many days to store samples. Most data is partitioned by dates. Partition Manager deletes data older than this number of days.
Options columns have the following buttons:
-
Remove Database- which removes the database and all of its samples from repository (it does not connect to Oracle database) -
Edit Database- modify parameters of database. UsuallyHistory Daysis modified to match available space required. Not all options can be changed after database is registered (e.g.Repository Schemacannot be change after created). -
Edit Credentials- (optional), used to store Oracle credentials used to connect to Oracle Database. This option should be used with care.
Databases
Databases table has some of its columns colored green, yellow or gray.
-
green means that samples are up2date and version of
APPM2schema is up2date -
yellow means that either samples are not collected in last 24h or that
APPM2schema is outdated. It can also mean that APPM Collector software is outdate and may not be fully compatible with this version of APPM Repository. -
grey means that collector is disabled for this database so we don’t care whether it is outdated or not (nothing is being collected for this database)
Available Versions & Available Space
On the bottom of the screen is a chart of how much space is still available for samples. This usually referrs
to amount of space available under /srv/appm mountpoint.
You can free some space by setting lower History Days and afterward Execute Partition Manager or you can
increase History Days if you see that you still have plenty of space available.
Repository → Groups
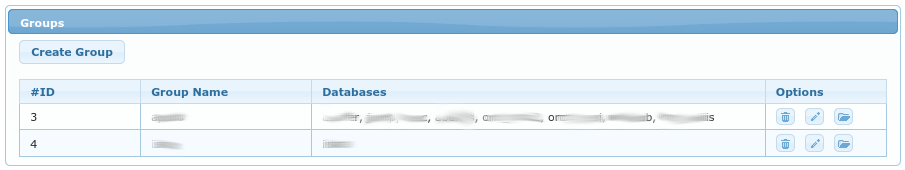
Here you have option to view databases as a group. You can think of group as a group of:
-
all databases on the same host
-
all pluggable databases in the same container
-
all RAC databases in the same cluster
One database can be a member of many groups. Currently, only Dashboard displays charts based on groups that are defined here.