Overview
Audit trail collection tool.

Arbiter is the ultimate tool for audit trail collection and management.
Audit trail is a sum of all information needed to present a histroical view of events related to the saved data and all the systems that collect, process and archive the data.
Audit trails must provide a way to present the time line of events related to any single business process and its data.
Information that audit trails provide must be sufficient to prove the credibility of the saved data. The creation and safekeeping of audit trails is of crucial importance to ensure its credibility and trustfulness.
Arbiter’s main characteristics include:
-
consolidation of audit trails coming from different applications and databases,
-
collecting audit trails at the database level requires no changes to the applications,
-
keeping track of all actions that happened at any event (logins, DDL, DML, DCL and TCL),
-
collection and manageability of audit trail data separated from production data,
-
pro-active system of detection and alarming of unauthorized insights and data manipulation,
-
ability to answer the most relevant questions about an incident (Who?, What?, When?),
-
using simple yet powerful web GUI.
User Interface
Login
Arbiter features web GUI application that users can use to work with Arbiter. Web GUI application can be accessed via web browser by entering the following URL:
https://<hostname>:8080/Where <hostname> should be replaced with the hostname or IP address of your Arbiter server. After successfully accessing Arbiter’s web application a login form is displayed and user is prompted to enter its credentials and select a database that they want to work with.
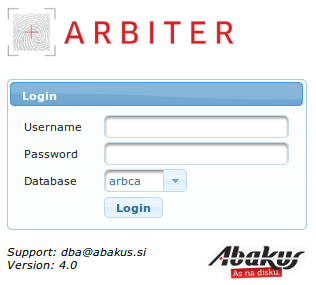
After entering all required data Login button should be pressed to proceed with login procedure. Correct credentials have to be entered to log in successfully otherwise errors indicating the issue are displayed. One Arbiter GUI can be used to connect to different Arbiter databases. If this is configured Database dropdown menu can be used to select which database Arbiter GUI will connect to.
User Interface Structure
After a successful login main part of Arbiter’s Graphical User Interface (GUI) is displayed.
Arbiter’s GUI consists of multiple parts from top to bottom of the page:
-
Title bar with Arbiter logo, navigation and user menu at top of the page.
-
Notification area below the part showing general information.
-
Main area taking up most of the screen. Through this part of GUI main Arbiter operations are performed.
-
Copyright information below the main area.
Logo and menus

At the top of each page Arbiter logo is displayed on the left side of the screen. Clicking this logo displays the starting page of Arbiter GUI.
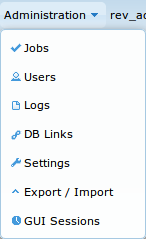
On the right side two dropdown menus are displayed:
-
Administration dropdown menu with the following items:
-
Jobs to manage Arbiter’s jobs.
-
Users to manage Arbiter’s users and user groups.
-
Logs to overview Arbiter’s logs.
-
DB Links to manage DB Links to databases monitored by Arbiter.
-
Settings to manage various Arbiter settings.
-
Export / Import exporting and importing preliminary data needed by arbiter to start collecting audit trails for a database.
-
GUI Sessions overview of Arbiter’s GUI web sessions history.
-
-
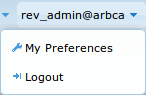
User menu called
<username>@<database>(username and database were selected at login) with the following items:-
My preferences for changing user’s password, documentation language and e-main notifications.
-
Logout to log out of Arbiter GUI. Login form is displayed after logging out.
-
|
Note
|
Administration menu is only displayed if the current user has administrative privileges. |
My Preferences
This page can be used to set current GUI user’s preferences. These preferences are changed by each user separately.
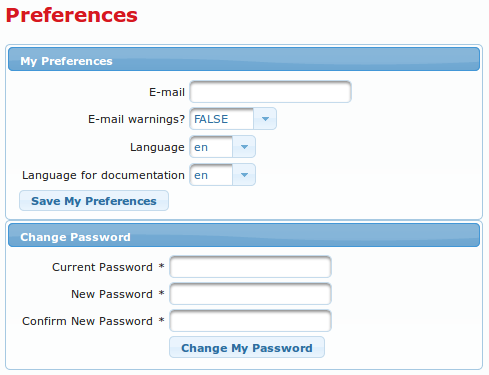
Preferences are split into two parts. Preferences of each part are saved separately by clicking corresponding buttons:
-
My Preferences:
-
E-mail input field. Arbiter is able to send out e-mails to notify users when warnings happen. This input field is used for entering the e-mail address for receiving those e-mail messages.
-
E-mail warnings? dropdown menu for enabling/disabling e-mail warning notification.
-
Language dropdown menu for setting GUI language.
-
Language for documentation dropdown menu for selecting documentation language.
-
Save My Preferences button to save all settings of the My Preferences section.
-
|
Note
|
for GUI and documentation only English language is available. |
-
Change password section to change current user’s password:
-
Current Password input field to enter user’s current password (mandatory).
-
New Password input field for new password (mandatory).
-
Confirm New Password input field to reenter new password (mandatory). Has to match New password.
-
Change My Password button to save all values in Change Password section.
-
Notification area
This area is populated only when at least one notification is present. Notifications can be anything from messages that indicate that something is being done, to warnings and critical faults. Different levels of notifications are represented with different colors:
-
Notification: blue.
-
Warning: yellow.
-
Critical: red.
Individual non system notifications can be dismissed by clicking the ![]() sign on the right side of each notification bar.
sign on the right side of each notification bar.
Main area
This part of GUI is used for most operations that are done with Backup server. By default list of Resources for the current user is displayed in this part of GUI after a successful login. More about user interfaces that are displayed in this part of GUI is explained in the following chapters of this user manual.
Copyright information
At the bottom of every GUI page copyright information is displayed.

Databases
Arbiter keeps audit trails for various databases. This page is Arbiter’s GUI homepage where basic information on these databases is displayed.
The page is separated into three sections:
-
Supervisor Findings displaying information on status of Arbiter.
-
Databases with list and status of databases audited by Arbiter.
-
Top Space Consumers basic information on Arbiter disk space consumption.
Sections are described in the following chapters.
Supervisor Findings Section
Supervisor is part of Arbiter monitoring its own health. It does so by running checks to monitor various system parameters. If parameter values exceed threshold values notifications are displayed in this section. The purpose of these notifications is to inform users and support personnel that certain manual actions are required.
Section is comprised of the following elements:
-
List of Supervisor notifications in form of a table with the following columns:
-
Check name.
-
Status check severity.
-
Last run date and time when check has run for the last time.
-
Message additional check information.
-
-
Run Supervisor Again button
 to manually starts supervisor job for the Arbiter to refresh Arbiter status information.
Databases Section
Second section is a list of databases that Arbiter is keeping audit trail for. Database are represented in a table where each row stands for one database. Below the table information about Arbiter’s disk space availability is displayed.
List of databases has the following information:
-
Expand button
 . Pressing this button offers administrative options for each database and only users with administrative privileges can access administrative options. These options are links:
-
Unregister Database link to open a dialog window asking for confirmation of database unregistration.
-
Tables link which opens a new page with a list of registered tables. More about this can be found in Table Registration chapter.
-
-
#Database column with unique number of the database.
-
Type of the database (oracle, mssql, …)
-
Common Name column with a friendly name for a database
-
Analytics link that opens a new page for creating and running Plan Query Testing requests. More about this can be found in Analytics chapter.
-
Explore link that opens a new page for creating and running various audit trail related queries. All audit trail queries, except for Plan Query Testing are created and run via this page. More about this can be found in Explore chapter.
-
Top Space link that opens a new page displaying detailed top space consumers information. More about this can be found in Top Space Consumers Page chapter.
-
Watermark column with date and time up until which revision trail has been processed for this database. Clicking this link opens a window called High-Watermarks displaying a list of various watermarks. High-watermarks is a list of jobs and their timestamps. These timestamps show to what time a certain job has processed revision trail data.
-
AUD$ with percentage of production database audit table saturation. This is only used and displayed when Arbiter is directly connected (using database link) with production database to collect its audit trail and metadata.
|
Note
|
This number should be low, if it exceeds 50% support personnel should be notified. |
-
Status icon
 representing database status.
Below Databases table information showing disk space for all disk groups and a button to register a new databases are displayed:
-
on the left side there is information showing disk space for all disk groups in the following format: Space usage for
<DISKGROUP_NAME>diskgroup is at<PERCENTAGE>% (<NUMBER_OF_GIGABYTES>GB). -
on the right side there is a button called Register New Database
 . This button starts the procedure of registering a new database to the Arbiter so it can start collecting its revision trail information. This button is only available to administrators.
Top Space Consumers Section
Because disk space critical Arbiter’s resource a large part of home screen is reserved for displaying this information.
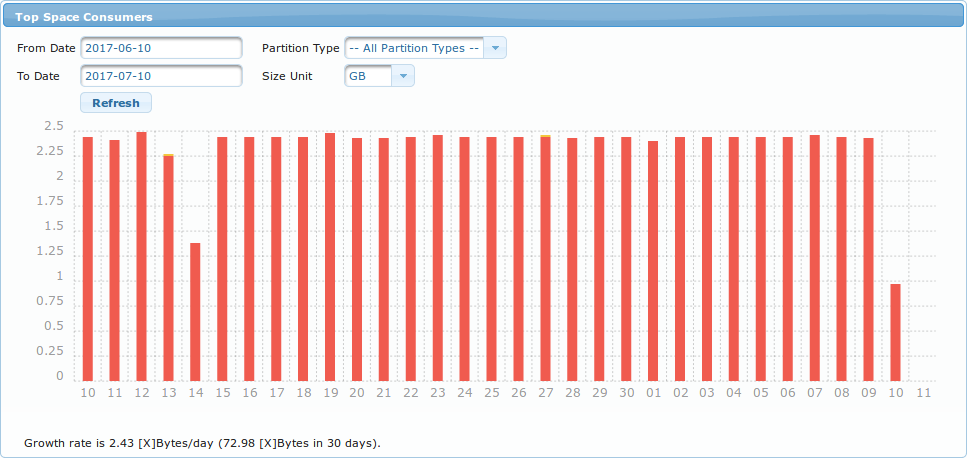
Top Space Consumers section is a graph that shows how much disk space is taken up by a certain partition type each day in a set time period. At the top of the graph there is an input form that can be used to control what is displayed on the graph. The following parameters can be set using this form:
-
From Date graph starting point. By default this value is set to one month backwards in time.
-
To Date graph ending point. By default this value is set to today.
-
Partition Type dropdown menu for selecting type of space consumers displayed. The following are available:
-
-- All Partition Types -- to display information on all partition types.
-
A$ (Audit Trail) audit trail partition type information.
-
D$ (Data Changes) data changes (old and new values) partition type information.
-
X$ (Other) all other data (meta data).
-
-
Size Unit represents units in which data is displayed. A dropdown menu offering:
KB,MB,GBandTB. -
Refresh button
 to redraw the graph with currently set parameters.
Just below the graph information about data growth rate is displayed in the following format: Growth rate is <SIZE_1> [X]Bytes/day (<SIZE_2> [X]Bytes in <NUMBER_OF_DAYS> days).
-
<SIZE_1>daily data growth rate. -
<SIZE_2>data growth size during time period selected in input form. -
<NUMBER_OF_DAYS>total number of days in the time period selected via input form. -
[X] stands for units selected in the Size Unit dropdown menu.
|
Note
|
refreshing the homepage or clicking logo at the top of the page resets the values of the input form. |
Analytics
Sometimes information is needed whether a certain ID has been accessed in a certain time period and what user accessed it. These kind of queries are called Plan Query Testing.
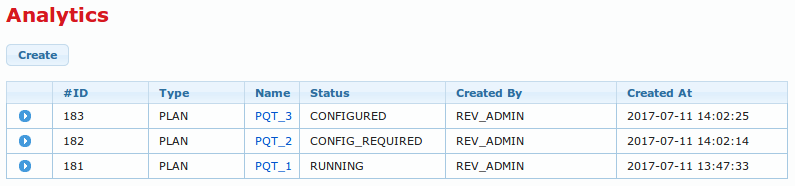
This page allows creating and running Plan Query Testing analytics. Because these analytical queries can take a very long time to run and return results this page can also be used for monitoring their progress. Each created analytics job is represented by one row in the table. Each row has the following columns:
-
Button to expand database
. Pressing this button offers an administrative options to drop the job represented by the row. This is a link called Drop pressing it instantly removes the selected job from the list. -
#ID unique job identifier.
-
Type of job. This is always set to
PLANfor analytics jobs. -
Name of job. This text is a link to a page that allows further query configuration or displays query status and results.
-
Status of job. It can gave the following values:
-
CONFIGURE_REQUIREDjob has been created but configuration has not yet been locked. -
CONFIGUREDjob’s configuration has been locked and can’t be changed. -
RUNNINGjob has been started and is running.
-
-
Created by username that this job was created by.
-
Crated at job creation date and time.
Above the table a button called Create  is located that can be used to start the procedure of creating a new analytics job.
Creating a new analytics job
When button Create above the list of Analytic jobs is pressed a new window appears that allows new Analytics job creation called Create Analytics Job.
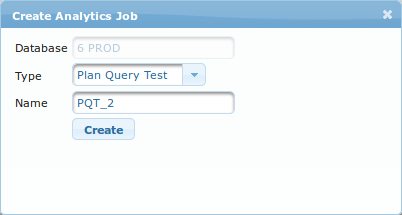
The only setting that need to be configured in this step is setting a unique name for a job into the Name input field. After entering a name for the job to be created button Create has to be clicked and new job appears on the list of analytics jobs with the name entered into Name input field.
Configuring and Running analytics job
When new analytics job is created its status is CONFIG_REQUIRED meaning that it needs to be configured first. To open job configuration page job name text link has to be clicked on the list of analytics jobs. A new page appears titled Analytics Job: <JOB_NAME>. This page allows for analytics job configuration and running.
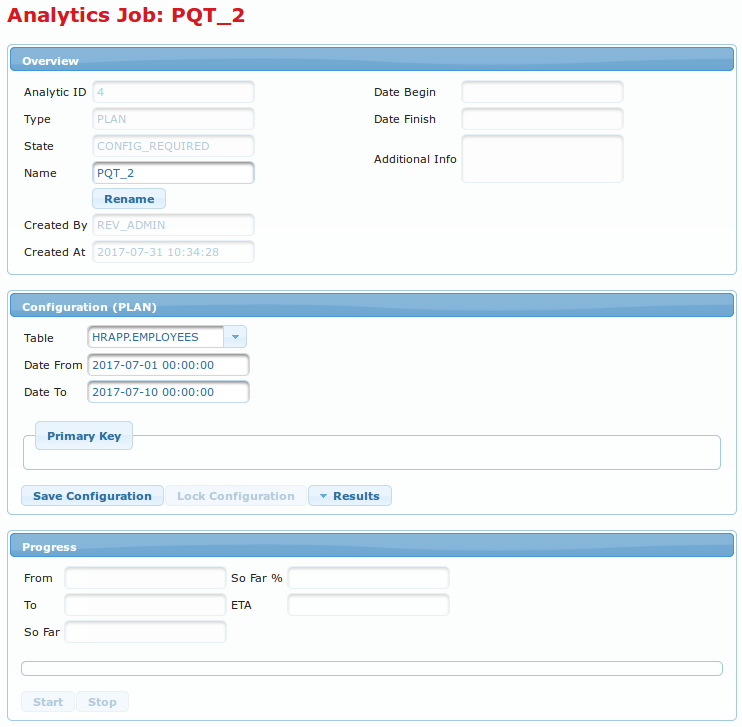
Analytics configuration page is split into three sections:
-
Overview section containing some basic analytics job information and an option to rename the job. It contains following elements:
-
Analytic ID text field with analytic job ID.
-
Type text field showing analytic job type.
-
State text field containing job status as described in Analytics chapter.
-
Name input field to set name for analytics job. This is the only value that can be configured in Overview section.
-
Rename button
 to rename the current analytics job.
 -
Created By text field containing username of user that created this analytics job.
-
Created At text field containing date and time when this analytics job was created.
-
Date Begin text field containing date and time when this analytics job was started.
-
Date Finish text field containing date and time when this analytics job has finished.
-
Additional Info text field with additional information about this analytics job.
-
-
Configuration (PLAN) section where all analytics job query configuration in performed. It contains following elements:
-
Table dropdown menu containing a list of tables that analytics jobs can be run on. Analytics job will be run against table selected from this menu.
-
Date From text field to set the beginning of the period for which the data will be queried.
-
Date To text field to set the end of the period for which the data will be queried.
-
Primary Key subsection containing <PK_NAME> input field to enter primary key value that will be queried.
<PK_NAME>is primary key column name. -
Save Configuration button
 to save current analytics job configuration. This job’s configuration can be changed later.
 -
Save Configuration button
 to lock current analytics job configuration. After locking job’s configuration it can not be changed any more.
 -
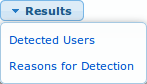
Results dropdown menu
 to display analytics job results in two different fashions which are given as options within dropdown menu:
-
-
Detected Users menu option to display information about which primary keys a specific database user has accessed. After selecting this option Results tab of Explore procedure is shown containing results of analytics job. It is a simple list of all database usernames that accessed primary key in selected time period. More about this can be found in Analytics Job Template chapter.
-
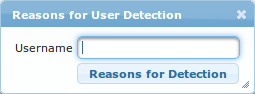
Reasons for Detection menu option to display information about which queries were run by specific database username accessing primary key. After clicking this button new window called Reasons for User Detection opens. This window features Username input filed to enter database username to query for and Reasons for Detection button
 to show results.
-
Progress section which is informational section for running and stopping analytics jobs and displaying their progress. It contains the following items:
-
From text field with date and time where analytics job started querying data. It can vary from date and time set in Date From input field in Configuration (PLAN) section.
-
To text field with date and time up until which analytics job has queried data. It can vary from date and time set in Date To input field in Configuration (PLAN) section.
-
So Far text field with date and time up until which analytics job has queried data.
-
So Far % text field with information on query progress in percent.
-
ETA text field with estimated time of analytics job completion.
-
Progress bar to represent analytics job’s progress graphically.
-
Start button
 to start analytics job.
 -
Stop button
 to stop analytics job.
-
Explore
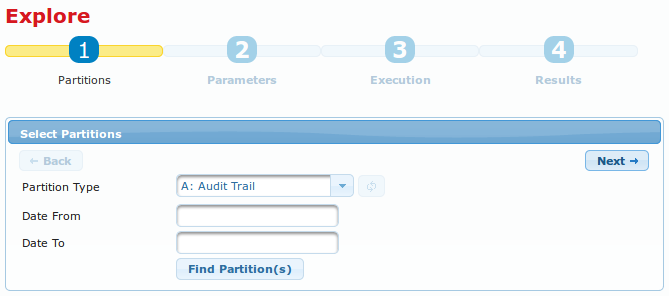
Explore page is used for digging through revision trail data in order to find out answers to certain audit trail related questions. These questions are queries within audit trail databases and their answers are results of this queries. Queries can be constructed and results displayed using Arbiter GUI. When this page is first opened it displays Partitions tab which is used to determine in what partitions and time period a query will run.
Only Plan Query Testing queries are constructed and ran through another interface, namely Analytics page, which is explained in Analytics chapter.
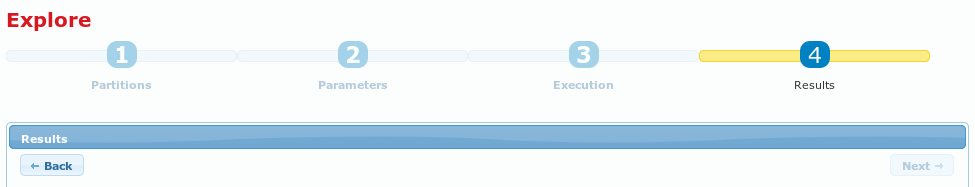
The Explore procedure is split into the follworing four steps:
-
Partitions: in this step revision trail data sources are selected. Queries will be performed on this data.
-
Parameters: this step is used for setting all revision trails query parameters.
-
Execution: displays queries that will be performed on partitions and query execution time estimation.
-
Results: displays revision trail query results.
Partitions tab
First step in revision trail query construction is selecting which data will be used as data set to be queried. Select Partitions section offers the following input fields:
-
Partition Type dropdown menu with the following items:
-
A: Audit Trail is standard Oracle audit trail data collected by Oracle Databases version 11.
-
A: Unified Audit Trail is standard Oracle audit trail data collected by Oracle Databases version 12.
-
D: Data Changes partition type containing information about data changes. Old and new data values are stored and displayed.
-
SX: Sessions is partition type that stores data about user sessions.
-
BG: Background Queries are complex long running queries. This is why Arbiter enables creation of queries that can be ran in the background. Results of such queries are stored and can be accessed at later time via these partitions.
-
SP: Stored Parameters to load previously stored audit trail query parameters. Arbiter audit trail query parameters can be stored for future use. Selecting this option offers a list of stored parameters to select from. Stored parameters also define which data partitons will be used as source for running revision trail queries. When stored parameters have to be run independedly form data partitions, stored parameters have to be selected in Parameters tab and required A:, D: or SX: partitons have to be selected in Partitons tab.
-
-
Refresh button
 to refresh list of partitions. This button is only enabled when BG: Background Queries or SP: Stored Parameters partition type is selected.
 -
Date From input field to enter partitions starting date.
-
Date To input filed to enter partitions ending date.
Selecting partitions
Different partition types require different parameters to be set to select data sets that queries will be performed on.
A: Audit Trail, A: Unified Audit Trail, D: Data Changes and SX: Sessions
These partition types require setting the following parameters: Date From and Date To. At least Date From has to be set to display partition list by clicking Find Partition(s) button  . If Date To input field is empty the current date will be used.
After clicking Find Partition(s) button a list of available partitions is displayed at the bottom of the page.

For these partition types table representing list of available partitions shows the following columns:
-
Checkbox for selecting partitions. Use title bar checkbox to select all partitions on the list.
-
Name of partition.
-
Date From starting date of data in this partition.
-
Date To ending date of data in this partition.
-
Last Analyzed showing when partiton has last been analysed. Arbiter has a job analyzing partitions. Time in this field tels when this job has analyzed the partition the last time. Only partitions older than three days are analyzed.
-
Number of Rows number of data rows in this partition.
-
Size in GB size of partition data in GB.
To select a partition check the checkbox in the first column of the partition list or check the checkbox in the title row to select all partitions on the list. After selecting partitions Next button  should be pressed to continue to the next step of Explore procedure.
BG: Background Queries and SP: Stored Parameters
These two types of partitions display lists of available partitions right after selecting Partition Type. For these two partition types only one partition from the list can be selected. This is why radio buttons are used for selecting desired partitions from the list.
When BG: Background Queries is selected the following options are available in partitions list:
-
Expand partition button
to display additional options:-
Drop link to drop selected stored query results.
-
Additional Info link for displaying additional information about a background query that is still running.
-
-
Radio button for selecting a partition.
-
ID partition identifier.
-
Name of partition.
-
Status current partition status.
-
Rows number of rows in this partition.
-
Size in GB size of data in this partition in GB.
If a job with status COMPLETED is selected from the list and button Next is pressed, results for selected job are displayed on the Results tab of the Explore page.
When SP: Stored Parameters is selected the following options are available in partitions list:
-
Expand partition button
to display additional options:-
Drop link to drop selected stored parameters.
-
-
Radio button for selecting a partition
 .
. -
Title of partition.
-
Crated By user that this stored procedure was created by.
-
Created At stored procedure creation time.
To select a partition select the radio button ![]() in the second column of the partition list and click Next button to continue to the next step of Explore procedure.
in the second column of the partition list and click Next button to continue to the next step of Explore procedure.
Parameters tab
Parameters tab is the second stage of Explore procedure. Here parameters for audit trail queries are set. This tab is the same for all partition types. Parts of this tab are different for different partition types.
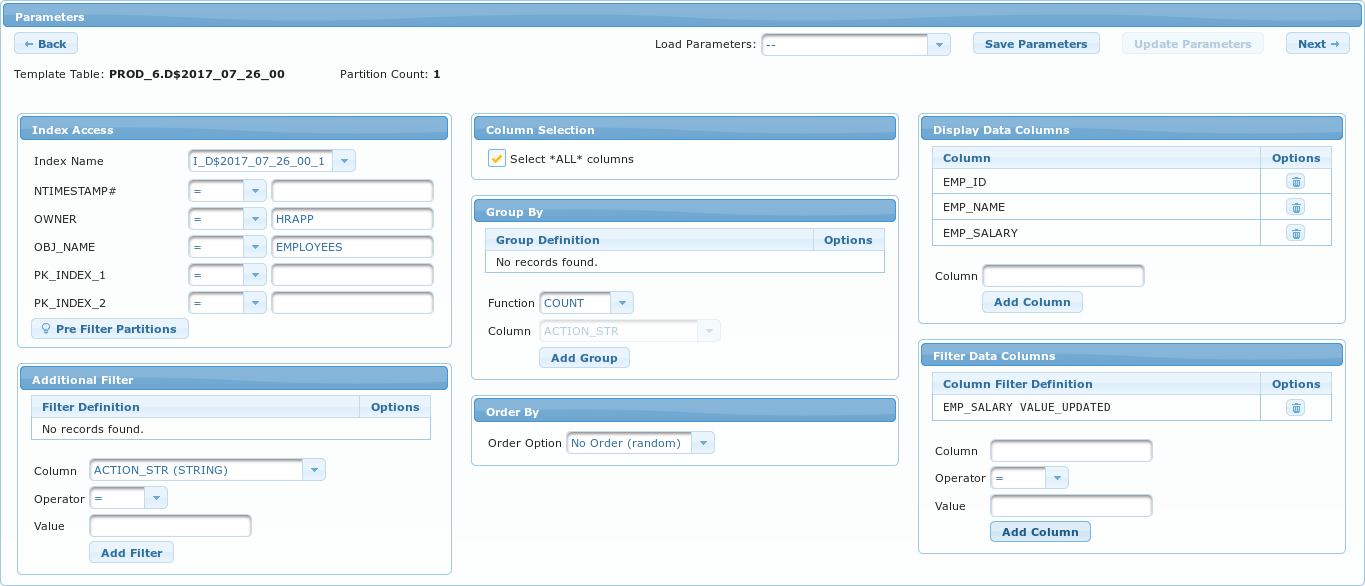
At the top of Parameters tab the following elements can be found:
-
Back button
 to return to Partitions tab.
 -
Load Parameters dropdown menu to load previously stored parameters into Parameters tab form. When loading Stored Parameters from Parameters tab, they are applied to partitions selected in Partitions tab. Stored Parameters can be loaded via Partitons Tab as well, but in those cases partitons are fixed to what was stored. This way of loading stored parameters is usefull when parameters have to be loaded independedly from source data partitions.
-
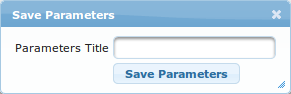
Save Parameters button
 to store parameters for future use. Stored parameters can be used in the future by selecting them in the Partitions tab which is described in Partitions Tab chapter or via Load Parameters dropdown menu described above. When this button is pressed a new window called Save Parameters is opened. This window has one input field called Parameters Title where a friendly name is entered and a Save Parameters button to store the parameters.
-
Update Parameters button
 to save parameter changes when stored parameters are used. If Stored Parameters were loaded in Partitons tab and other parameters were loaded via Load Parameters dropdown menu and Update Parameters button was pressed, parameters selected in Parameters tab will get updated.
 -
Next button
to continue to the next stage of explore. -
Template Table: followed by the name of template table. Template table is one of the selected partition tables that is used to extract list of parameters from.
-
Partition Count: followed by the number of selected partitions.
Parameters tab consists of the following sections:
-
Index Access section to filter partitions that will be queried. This section only filters by indexed columns.
-
Additional Filter section to filter partitions that will be queried as well but it only filters by non indexed columns.
-
Column Selection section to modify the list of selected columns.
-
Group By section for grouping query results.
-
Order By section to sort query results.
-
Display Data Columns section that controls which data columns will be displayed as D: Data Changes query results. Only available when D: Data Changes partition type is selected.
-
Filter Data Columns section to filters data rows of D: Data Changes query results. Only available when D: Data Changes partition type is selected.
Sections are described in the following chapters.
Index Access section
This section consists of:
-
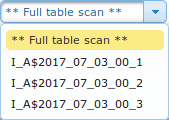
Index Name dropdown menu for selecting an index. The default option is
** Full table scan **meaning that no filtering will be done. When value different from** Full table scan **is selected a list of indexed columns is displayed below the dropdown menu. Entering values into the list will filer query results. One or more filters can be entered. Each row of the list contains the following elements:-
Column name - a string representing name of the column to filter by.
-
Operator - an operator for creating a where condition. The following are available: =, !=, >, >=, <, ⇐, IS NULL and IS NOT NULL.
-
Value - an input field to enter a string to filter by.
-
-
Pre Filter Partitions button
 to filter out the partitions that don’t meet the entered filters requirements. This can speed up the final query.
Descriptions of individual partition data columns can be found in Partition data columns chapter.
Additional Filter section
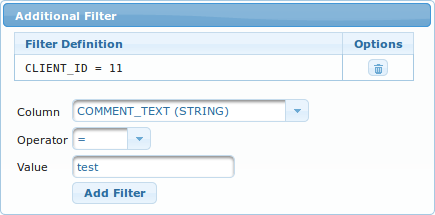
This section is the continuation of the previous and can be used to enter additional data filtering conditions, but only on unindexed columns.
This section consists of the following elements:
-
List of defined filters
-
Column selection dropdown menu
-
Operator selection dropdown menu
-
Value input field
-
Add Filter button
 to add the entered filter condition to the list of defined filters.
Descriptions of individual partition data columns can be found in Partition data columns chapter.
Column Selection section
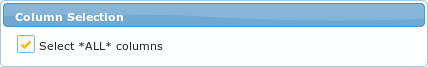
By default all partition data columns are included in query results. To change this setting and display additional options of this section checkbox Select \*ALL columns* has to be unchecked. When this checkbox is unchecked, section expands as displayed on the following screenshot:
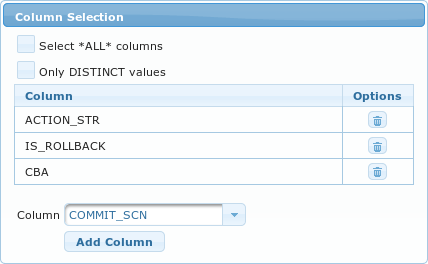
This section in its expanded form consists of the following elements:
-
Select *ALL* columns checkbox - check it to collapse the section.
-
Table with a list of columns to be included in the results. Table has the following columns:
-
Column - selected column name.
-
Delete button
 to remove the column from the list.
-
-
Column dropdown menu containing a list of all partition columns that have not yet been added to the list.
-
Add Column button
 to add the selected column to the list.
Descriptions of individual partition data columns can be found in Partition data columns chapter.
Group By section
This section allows grouping of query results to performing some mathematical operations on partition data.
Section contains the following elements:
-
table containing a list of defined group definitions with the following columns:
-
Group Definition column contains description of group definition
-
Delete button
- to remove group definition.
-
-
Function dropdown menu with the following functions:
-
COUNT- counts all rows of selected partitions. No column can be selected for this function. -
SUM- calculates sum of all values for selected column. -
AVG- calculates average value for selected column. -
MIN- calculates minimal value for selected column. -
MAX- calculates maximal value for selected column.
-
-
Column dorpdown menu to select partition data column that function will be performed on. When function
COUNTis selected this dropdown menu is disabled. -
Add Group button
 to add the configured group definition to the list.
|
Warning
|
Grouping will be slow due to data selection/filter. Because grouping is costly operation queries that use grouping will run slower. |
|
Warning
|
Grouping will override selected ALL column list. When grouping is used and Select ALL columns checked, grouping will override this setting. |
Descriptions of individual partition data columns can be found in Partition data columns chapter.
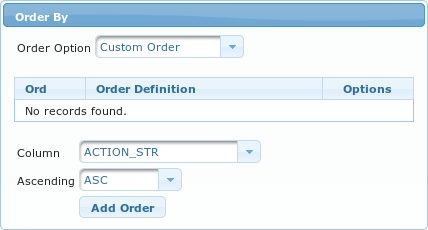
Order By section
Query results are returned without any specific order. Result data can be sorted by using options of this section.
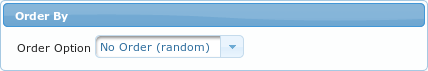
Section in its default state consists of one dropdown menu called Order Option with the following values:
-
No Order (random)- the default option. -
By Index- results will be ordered by the index. -
Custom Order- this option allows the creation of custom order configurations. When this option is selected section expands and contains the following additional elements:-
Table representing a list of order definitions with the following columns:
-
Ord - order ID stands for the sequence in which order definitions will be applied.
-
Order Definition - string representing order definition that is composed from column name and sort direction.
-
Options buttons:
-
Move up button
 to move order definition to higher position.
 -
Move down button
 to move order definition to lower position.
 -
Delete button
to delete order definition.
-
-
-
Column dorpdown menu with a list of available partition data columns.
-
Ascending dropdown menu to select sort direction. The following values are available:
-
ASC- results will be sorted in ascending order -
DSC- result will be sorted in descending order
-
-
Add Order button
 to add order definition to the list.
-
Descriptions of individual partition data columns can be found in Partition data columns chapter.
Display Data Columns section
This section can only be used for D: Data Changes partitions. Data changes partitions store old and new values of production databases. Consequently containing production data. In this section display of production data in result sets can be controlled. Because tables that are subjects of audit trailing usually contain many attributes, by default no production columns are displayed in query results.
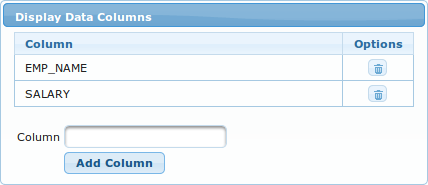
This section contains the following elements:
-
Table representing a list of data columns that will be displayed in the results, with the following columns:
-
Column - data column name
-
Delete button
to delete display column.
-
-
Column input field - data column name should be entered here.
-
Add Column button
- to add data column to the list.
Filter Data Columns section
This section can only be used for D: Data Changes partitions. Data changes partitions store old and new values of production databases. Consequently containing production data. In this section display of production data in result sets can be filtered.
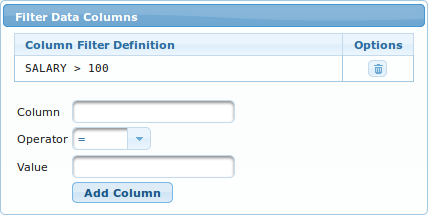
This section contains the following elements:
-
Table representing a list of data column filters, with the following columns:
-
Column Filter Definition - filter definition in the following format: <COLUMN_NAME> <OPERATOR> <VALUE>
-
Delete button
to delete column filter.
-
-
Column input field - data column name should be entered here.
-
Operator selection dropdown menu. The following operators are available: =, !=, LIKE, NOT LIKE, REGEXP_LIKE, IS NULL, IS NOT NULL and VALUE_UPDATED. VALUE_UPDATED filter shows only revision trail entries for which value of Column has changed.
-
Value input field to enter the value to be combined with the operator. When IS NULL, IS NOT NULL or VALUE_UPDATED oprator is selected this input field is disabled.
-
Add Column button
- to add data column filter to the list.
Partition data columns
Partitions that will be queried can be filtered before running audit trail queries on data within them. Audit trail queries often have to dig through large amounts of data causing them to be very time consuming. This is why it is recommended to reduce the data that Arbiter has to search through as much as possible. Arbiter enables this via filtering partitions data. Different partition types have different partition columns. The first table contains a list of columns available for A: Audit Tail or A: Unified Audit Trail partition types and the second one columns for D: Data Changes partition types. Explore procedure results can be modified by selecting result columns, grouping and ordering results. In this operations partition data columns are used as well.
| Column name and partition types | Description |
|---|---|
ACTION (NUMBER) |
Numeric action type code. |
ADMIN_OPTION (STRING) |
Indicates whether the role or system privilege was granted with the ADMIN option |
CLIENT_ID (STRING) |
Client identifier in each Oracle session |
CLIENT_IP (STRING) |
Name of the object affected by the action |
CLIENT_PROGRAM (STRING) |
Obsolete |
COMMENT_TEXT (STRING) |
Text comment on the audit trail entry, providing more information about the statement audited. Also indicates how the user was authenticated. |
ENTRYID (NUMBER) |
Numeric ID for each audit trail entry in the session |
GLOBAL_UID (STRING) |
Global user identifier for the user, if the user has logged in as an enterprise user |
GRANTEE (STRING) |
Name of the grantee specified in a GRANT or REVOKE statement |
INSTANCE_NUMBER (NUMBER) |
Instance number as specified by the INSTANCE_NUMBER initialization parameter |
LOB_MARKER (NUMBER) |
Obsolete |
LOGOFF_TIME (DATE) |
Date and time of user log off |
MSSQL_CREATED (DATE) |
Obsolete |
MSSQL_LOGIN (STRING) |
Obsolete |
NEW_NAME (STRING) |
New name of the object after a RENAME or the name of the underlying object |
NEW_OWNER (STRING) |
Owner of the object named in the NEW_NAME column |
NTIMESTAMP# (DATE) |
Timestamp of the creation of the audit trail entry (timestamp of user login for entries created by AUDIT SESSION) in UTC (Coordinated Universal Time) time zone (STRING) |
OBJ_NAME (STRING) |
Name of the object affected by the action |
OBJ_PRIVILEGE (STRING) |
Object privileges granted or revoked by a GRANT or REVOKE statement |
OS_PROCESS (STRING) |
Operating System process identifier of the Oracle process |
OS_USERNAME (STRING) |
Operating system login username of the user whose actions were audited |
OWNER (STRING) |
Creator of the object affected by the action |
PREFIX (STRING) |
Obsolete |
PRIV_USED (STRING) |
System privilege used to execute the action |
PROXY_SESSIONID (NUMBER) |
Proxy session serial number, if an enterprise user has logged in through the proxy mechanism |
RETURNCODE (NUMBER) |
Oracle error code generated by the action. Some useful values: 0 - Action succeeded, 2004 - Security violation. |
REV_SESSION_ID (NUMBER) |
Numeric ID for each Oracle session unique for complete revision trail. |
REV_SESSION_TS (DATE) |
Session start timestamp. |
REV_SOURCE (STRING) |
Audit trail log filename that audit trail record is located in. |
REV_TRANSACTION_ID (STRING) |
Transaction identifier of the transaction in which the object is accessed or modified, unique for complete revision trail. |
REV_TRANSACTION_TS (DATE) |
Transaction start timestamp. |
SCN (NUMBER) |
System change number (SCN) of the query |
SESSIONID (NUMBER) |
Numeric ID for each Oracle session |
SES_ACTIONS (STRING) |
Session summary (a string of 16 characters, one for each action type in the order ALTER, AUDIT, COMMENT, DELETE, GRANT, INDEX, INSERT, LOCK, RENAME, SELECT, UPDATE, REFERENCES, and EXECUTE. Positions 14, 15, and 16 are reserved for future use. The characters are: - - None, S - Success, F - Failure, B - Both. |
SQL_BIND (STRING) |
Bind variable data of the query |
SQL_BIND_CLOB (STRING) |
Bind variable data of the query when bind string is longer than 2000 characters |
SQL_BIND_LEN (NUMBER) |
SQL_BIND or SQL_BIND_LEN variable length |
SQL_TEXT (STRING) |
SQL text of the query |
SQL_TEXT_CLOB (STRING) |
SQL text of the query when string is longer than 2000 characters |
SQL_TEXT_LEN (NUMBER) |
SQL_TEXT or SQL_TEXT_CLOB length |
STATEMENT_ID (NUMBER) |
Numeric ID for each statement run |
SYS_PRIVILEGE (STRING) |
System privileges granted or revoked by a GRANT or REVOKE statement |
TERMINAL (STRING) |
Identifier of the user’s terminal |
TRANSACTION_ID (STRING) |
Transaction identifier of the transaction in which the object is accessed or modified |
USERHOST (STRING) |
Client host machine name |
USERNAME (STRING) |
Name (not ID number) of the user whose actions were audited |
| Column name and partition types | Description |
|---|---|
ACTION_STR (STRING) |
Numeric action type code. |
CBA (NUMBER) |
Indicates whether the role or system privilege was granted with the ADMIN option |
COMMIT_SCN (NUMBER) |
Client identifier in each Oracle session |
IS_ROLLBACK (NUMBER) |
Name of the object affected by the action |
MULTILINE_CONTINUE (NUMBER) |
Obsolete |
MULTILINE_GROUP (STRING) |
Text comment on the audit trail entry, providing more information about the statement audited. Also indicates how the user was authenticated. |
MULTILINE_ORDER (NUMBER) |
Numeric ID for each audit trail entry in the session |
NTIMESTAMP# (DATE) |
Timestamp of the creation of the audit trail entry (timestamp of user login for entries created by AUDIT SESSION) in UTC (Coordinated Universal Time) time zone (STRING) |
OBJ_NAME (STRING) |
Name of the object affected by the action |
OPERATION_CODE (NUMBER) |
Instance number as specified by the INSTANCE_NUMBER initialization parameter |
OWNER (NUMBER) |
Creator of the object affected by the action |
PK_INDEX_1 (NUMBER) |
Date and time of user log off |
PK_INDEX_2 (NUMBER) |
Obsolete |
PREFIX (STRING) |
Obsolete |
RESET_SCN (NUMBER) |
New name of the object after a RENAME or the name of the underlying object |
REV_SESSION_ID (NUMBER) |
Numeric ID for each Oracle session unique for complete revision trail. |
REV_SESSION_TS (DATE) |
Session start timestamp. |
REV_SOURCE (STRING) |
Audit trail log filename that audit trail record is located in. |
REV_TRANSACTION_ID (STRING) |
Transaction identifier of the transaction in which the object is accessed or modified, unique for complete revision trail. |
REV_TRANSACTION_TS (DATE) |
Transaction start timestamp. |
SCN (NUMBER) |
System change number (SCN) of the query |
SESSIONID (NUMBER) |
Numeric ID for each Oracle session |
SESSION_INFO (STRING) |
Timestamp of the creation of the audit trail entry (timestamp of user login for entries created by AUDIT SESSION) in UTC (Coordinated Universal Time) time zone (STRING) |
SQL_REDO (STRING) |
Object privileges granted or revoked by a GRANT or REVOKE statement |
SQL_REDO_MULTI (STRING) |
Operating System process identifier of the Oracle process |
TRANSACTION_ID (STRING) |
Transaction identifier of the transaction in which the object is accessed or modified |
USERNAME (STRING) |
Name (not ID number) of the user whose actions were audited |
| Column name and partition types | Description |
|---|---|
COMMENT_TEXT (STRING) |
Text comment on the audit trail entry, providing more information about the statement audited. Also indicates how the user was authenticated. |
RETURNCODE (NUMBER) |
Oracle error code generated by the action. Some useful values: 0 - Action succeeded, 2004 - Security violation. |
REV_LOGOFF (DATE) |
Date and time of session log off |
REV_SESSION_ID (NUMBER) |
Numeric ID for each Oracle session unique for complete revision trail. |
REV_SESSION_TS (DATE) |
Session start date and time. |
REV_SOURCE (STRING) |
Audit trail log filename that audit trail record is located in. |
SESSIONID (NUMBER) |
Numeric ID for each Oracle session |
USERNAME (STRING) |
Name (not ID number) of the user whose actions were audited |
Execution tab
This tab displays detailed information about query, how it will run and how results will be displayed.
Execution tab consists of the following elements:
-
Main section called Execution that contains control buttons and other sections. At the top of this section the following Explore procedure control buttons are located:
-
Back button
to return to Parameters tab. -
Background Execution button
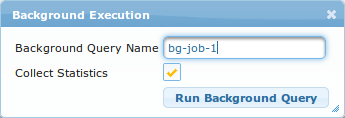
 to run query in the background and not interrupt GUI operation. Some queries can take a long time to execute. By default while queries are running Arbiter GUI displays a status window showing query execution progress and no other operations can be done using Arbiter GUI. This is why background execution is available to run comprehensive queries in the background. When this button is pressed a new window called Background Execution appears. This window consist of following elements:
-
Input field Background Query Name - to enter a name for this background job so it can be identified on the list of running background queries on the Partitions tab of Explore page.
-
Checkbox Collect Statistics - to select whether statistics are to be collected for this background job.
-
Run Background Query button
 to run the job in the background, close Background Execution window and return Arbiter GUI to Partitions step of Explore procedure. After a background query is started it is queued up with other background queries and displayed as one of BG: Background Queries partitions as explained in Partitions tab chapter.
-
-
-
Download Report button
 to open a window called Download Report which allows download of query results to a file. Download Report window consists of the following elements:
-
Report Format dropdown menu to select a desired file format.
-
Download Report button
to initiate download of results file.
-
-
Next button
to proceed to the next step of Explore procedure. When this button is pressed query execution begins. During query execution time a new window called Query Execution Progress is displayed. This window automatically closes and Results tab is displayed when query execution finishes.-
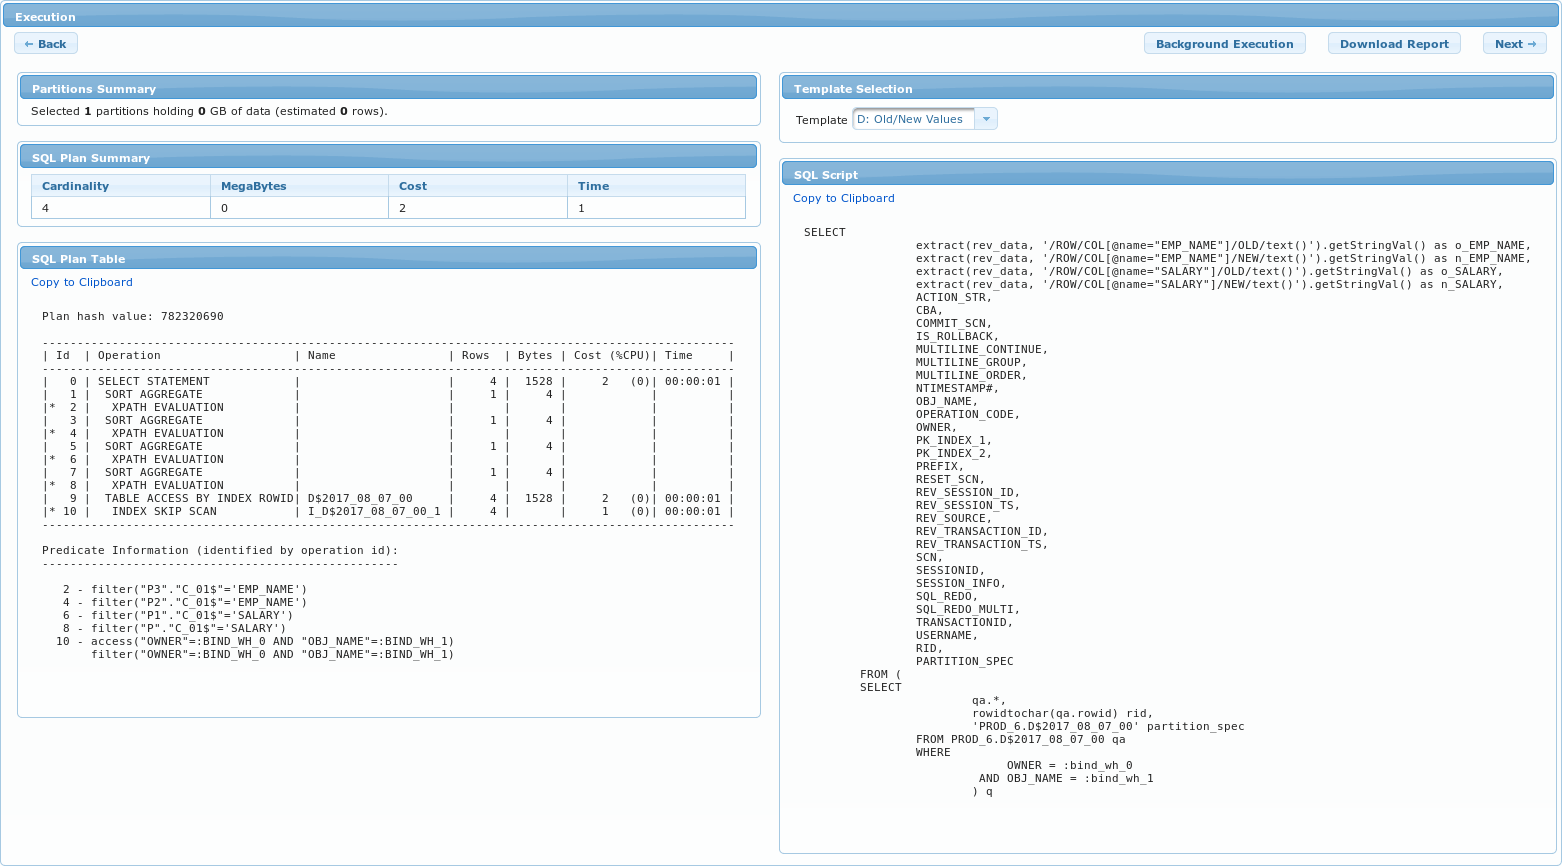
Partitions Summary section - basic information about the partitions that query will run on.
-
SQL Plan Summary section - basic information about query execution plan.
-
SQL Plan Table section - SQL query execution plan table.
-
Template Selection section - for selecting template that will be used to display query results.
-
SQL Script section - SQL query that will be run.
-
Partitions Summary section

This section displays basic selected partitions information in a single row in the following format:
Selected <NUMBER_OF_PARTITIONS> partitions holding <SIZE_OF_DATA> GB of data (estimated <NUMBER_OF_ROWS> rows).
Where parameters stand for:
-
<NUMBER_OF_PARTITIONS> - number of partitions to query
-
<SIZE_OF_DATA> - size of partition data to be queried
-
<NUMBER_OF_ROWS> - number of rows in partitions to query
SQL Plan Summary section
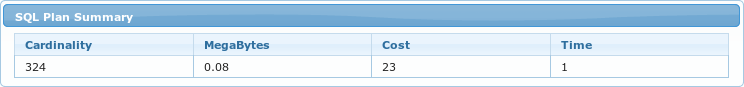
Displays summary of SQL execution plan in a table with parameters:
-
Cardinality - number of predicted rows in result set
-
MegaBytes - estimation of amount of data to be queried
-
Cost - Oracle CPU cost estimation
-
Time - estimated time of query execution in seconds
SQL Plan Table section
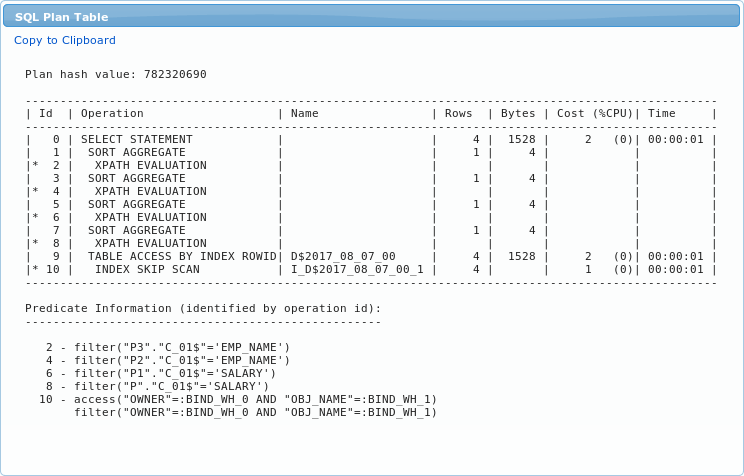
This section displays Oracle’s SQL query execution plan. Plan’s text can be copied by clicking on Copy to clipboard link at the top of the section.
Template Selection section

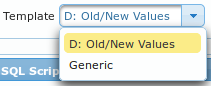
Arbiter uses templates to display query results. Templates are usually predefined and fixed based on selected partition type. In those cases Template dropdown menu is disabled and option Generic is selected. Only when the following conditions are met, template can be changed:
-
partition type D: Data Changes is selected
-
the following partition data column filters are set in Parameters tab: OWNER and OBJ_NAME
If above conditions are met, template dropdown menu is enabled and the following options are available:
-
D: Old/New Values - this template is specially designed to display the selected columns old and new values. D: Data Changes partitions are specifically designed to store data change information and thus need a different template to display these changes. Each partition row holds information about old/new values for all registered columns, but only columns that have been selected in Display Data Columns section of Parameters tab will be displayed in results.
-
Generic - used for all other partition types
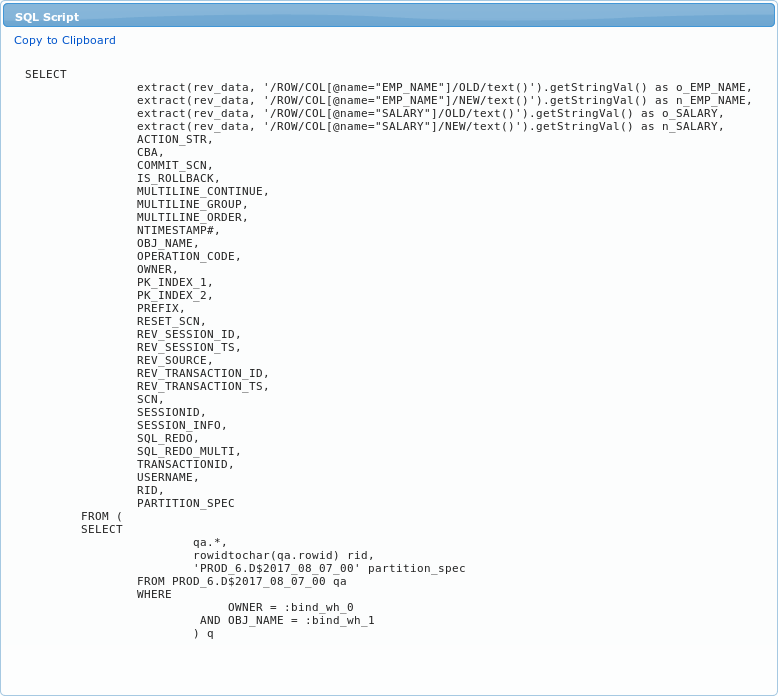
SQL Script section
This section contains SQL statement constructed through various steps of Explore procedure. This SQL query will run against Arbiter’s database. SQL script text can be copied by clicking on Copy to clipboard link at the top of the section.
Query Execution Progress window
When button Next to proceed to the next step of Explore procedure is pressed query execution begins. During this time a new window called Query Execution Progress is displayed. This window automatically closes and Results tab is displayed when query execution finishes.
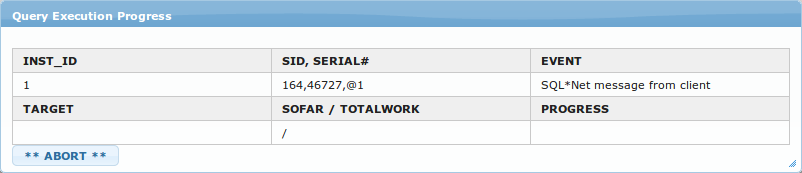
Information displayed in Query Execution Progress window:
-
INST_ID - ID of node running the query.
-
SID, SERIAL# - Identifier and serial number of the session processing the long-running operation. If multiple sessions are cooperating in the long-running operation, then SID and SERIAL# correspond to the main or master session.
-
EVENT - Resource or event for which the session is waiting. It explains what query is currently doing.
-
TARGET - Object on which the operation is carried out.
-
SOFAR / TOTALWORK - Units of work done so far for the operation specified in the OPNAME column / Total units of work for the operation specified in the OPNAME column.
-
PROGRESS - Audit trail query progress in %.
Results tab
Last step of Explore procedure is presentation of audit query results. At the top of the Results main section two buttons are located:
-
Back button
to go to the previous step of Explore procedure. -
Disabled button Next. This button is disabled because this is the last step of Explore procedure.
Each different partition type uses different template to display query results. By partition type the following result templates can be displayed:
-
A: Audit Trail and A: Unified Audit Trail can use two different templates:
-
A$ Standard specially designed to display Oracle’s audit trail information
-
Generic shows more partition data columns and less data query information
-
-
D: Data Changes can use two different templates as explained in Template Selection section chapter:
-
D: Old/New Values template that displays data changes for selected data columns
-
Generic shows partition data columns, without actual data change values
-
-
SX: Sessions template to display database user session information
In the following chapters above mentioned templates are described in more detail.
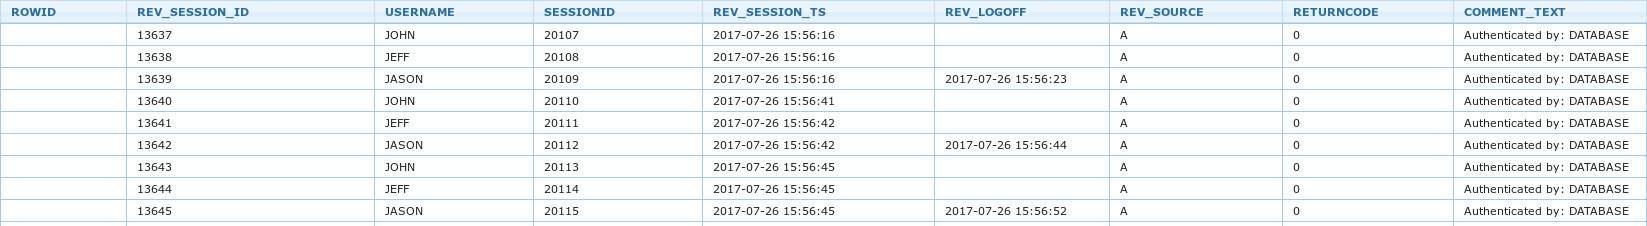
Audit Trail Standard template
Two different templates can be used to display standard Oracle’s audit trail query information. By default A$ Standard template type is selected. This template is recommended for displaying standard audit trail results as it shows more data query details.
Each row of this template shows information about one audit trail record. Within one row, multiple rows appear displaying the following data:
-
Top row consists of the following standard Oracle audit trail columns: NTIMESTAMP#, OWNER OBJ_NAME, USERNAME, OS_USERNAME, TERMINAL, CLIENT_IDENT and their corresponding values. More information on these columns can be found in Partition data columns chapter.
-
In the second row SQL query that was run on production database and has generated audit trail is displayed. Query text is a link. When this link is clicked it expands this cell and displays another copy of the same query but with bind variables translated into concrete values.
-
at the bottom of the row three button can be found:
-
Audit Details button
 - opens a new window showing all standard Oracle audit data column values like show on the screenshot below.
 -
Bind Variables button
 - opens a new window with a list of this SQL statement’s bind variables and their concrete values.
-
-
Download statement button
 - opens a windows to download text file containing SQL statement text.
The following window shows standard Oracle audit trail columns and their values.
Audit Trail Generic template
Each row of this template shows information about one audit trail record. The results table contains all the standard audit trail columns and their corresponding values. More information on these columns can be found in Partition data columns chapter.
Data Changes Old/New values template
This is default template for D: Data Changes partition type. Besides three partition data columns selected production columns new and old values are displayed.
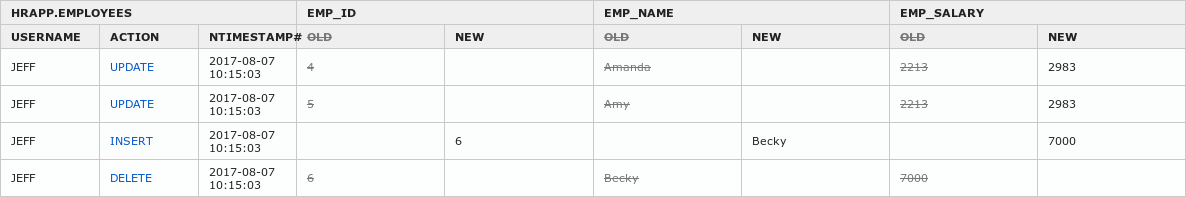
Results table contains the following columns:
-
First three columns are partitions data columns: USERNAME, ACTION, NTIMESTAMP#. More information on these columns can be found in Partition data columns chapter.
-
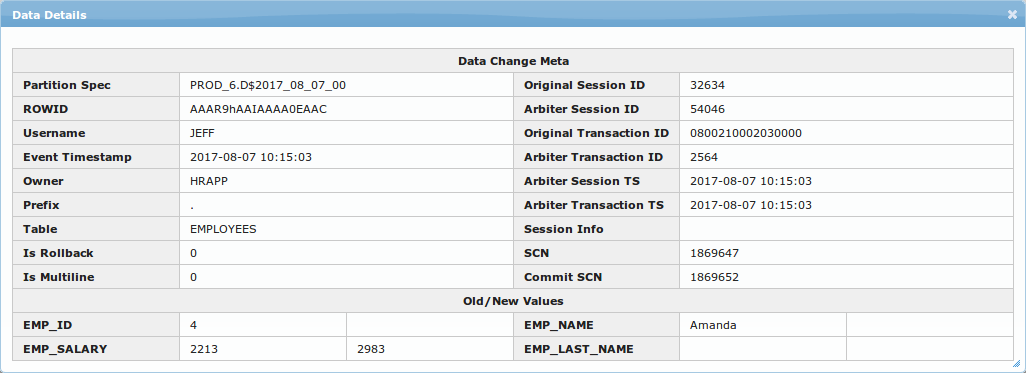
The second column called ACTION is a link. When this link is clicked a new window called Data Details is displayed. This window contains detailed information about the data change record.
-
-
the continuation of this table are selected production columns. For each selected production column two sub-columns are present representing old and new value of the selected column.
Data Changes Generic template
Each row of this template shows information about one data changes record. The results table contains all the standard audit trail columns and their corresponding values. More information on these columns can be found in Partition data columns chapter.
Sessions Standard template
This is the most useful template to be used for sessions partition type.
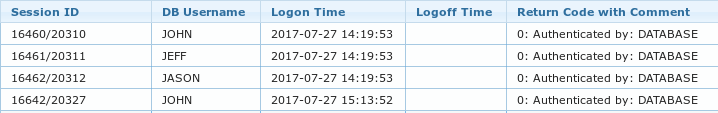
Each row of results set represents one database user session. Each row contains the following information:
Text in each row can be clicked to open a new window containing list of database transactions for this session.
Sessions Generic template
Each row of this template shows information about one data changes record. The results table contains all the standard audit trail columns and their corresponding values. More information on these columns can be found in Partition data columns chapter.
Analytics job template
Missing
Top Space Consumers Page
This page allows for more in detail analysis of Arbiter’s space consumption. Basic space consumption information is available on Arbiter’s main page.
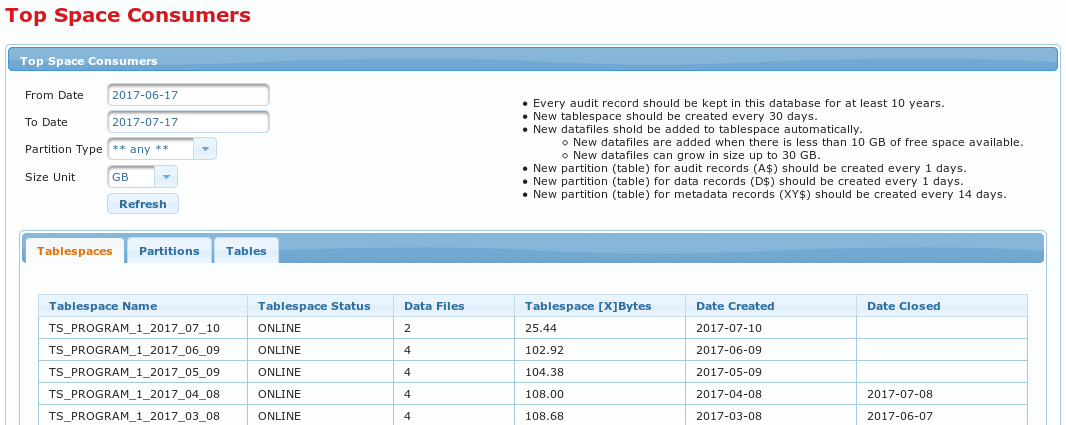
This page is constructed of a table displaying space consumers information and an input form for filtering this information. Filter input form has the following fields to filter output data:
-
From Date - date from which the information will be displayed.
-
To Date - date up to which information will be displayed.
-
Partition Type - partition types that the information will be displayed about. If
*** any ***is selected all partitions are included. Any other option will display information only about the selected partition type. -
Size Unit - units that the information will be displayed in.
-
Refresh button
to filter and display information according to the selected filter parameters.
To the right of the filter input form rules on how space consumers are created is displayed.
Table displaying top space consumers information can be displayed in three modes: Tablespaces, Partitions and Tables. Switching between these modes is done by clicking on according tabs at the top of the table displaying space consumers information. Depending on the selected display mode the following table columns are displayed:
-
Tablespaces:
-
Tablespace Name - name of the tablespace.
-
Tablespace Status - status o a tablespace.
-
Data Files - number of datafiles belonging to a tablespace.
-
Tablespace [X]Bytes - the size of the tablespace in units selected in the filter input form.
-
Date Created - tablespace creation date.
-
Date Closed - date when the tablespace was closed.
-
-
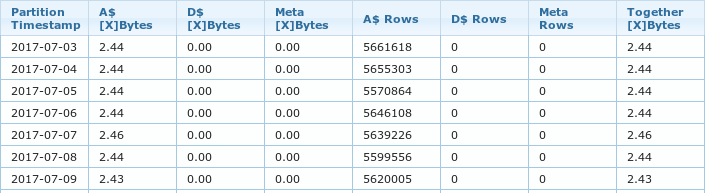
Partitions:
-
Partition Timestamp - date of the information displayed by the row
-
A$ [X]Bytes - space consumption for A$ partition type at a certain timestamp in units selected in the filter input form.
-
D$ [X]Bytes - space consumption for D$ partition type at a certain timestamp in units selected in the filter input form.
-
Meta [X]Bytes - space consumption for XY$ (meta) partition type at a certain timestamp in units selected in the filter input form.
-
A$ Rows - number of rows collected for A$ partition type at a certain timestamp.
-
D$ Rows - number of rows collected for D$ partition type at a certain timestamp.
-
Meta Rows - number of rows collected for XY$ (meta) partition type at a certain timestamp.
-
together [X]Bytes - space consumption of all partition types at a certain timestamp in units selected in the filter input form.
-
-
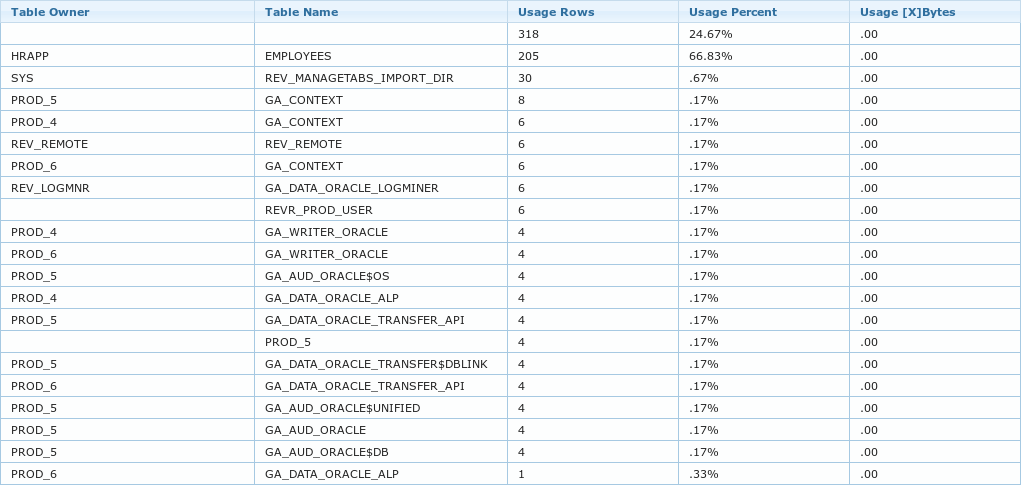
Tables:
-
Table Owner - table owner username.
-
Table Name - table name.
-
Usage Rows - number of rows collected for table represented by the row.
-
Usage Percent - percentage of total space consumption by the table in the row compared to complete space usage as filtered by the filter input form.
-
Usage [X]Bytes - table space consumption compared to complete space consumption displayed as filtered by the filter input form.
-
Administration Interface
When logged in with administrator account "Administration" menu is displayed at the top right corner of Arbiter GUI. Basic information about "Administration menu" is available in Logo and Menus chapter.
Jobs
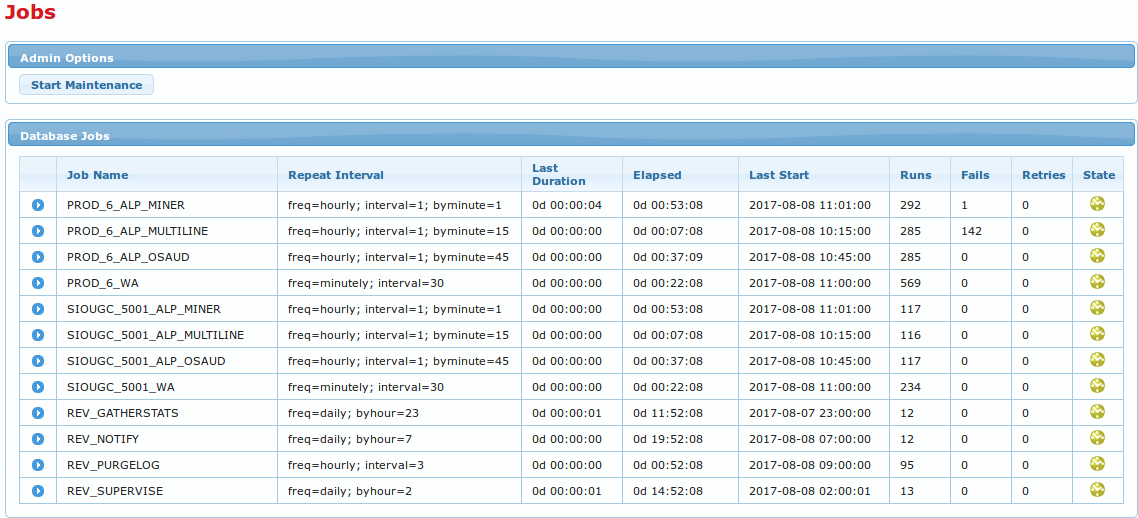
Here a table with a list of jobs and their statuses running on Arbiter is displayed.
At the top of the page a section called Admin Options can be found. This section contains one button called Start Maintenance  can be found. When this button is pressed all Arbiter jobs are stopped. This mode is used while maintenance procedures are being done on the Arbiter. While this mode is enabled, Arbiter jobs can’t be started. While maintenance mode is active, a warning letting users know about it is displayed at the top of each GUI page like show on the image below. While in maintenance mode is active a button Stop Maintenance
  is shown in Admin Options section. Pressing this button restarts all Arbiter jobs and returns Arbiter to normal operation mode.

This page is automatically refreshed every 5 seconds. Each row in the table represents one job. For each job the following information is displayed:
-
Expand job button
. Pressing this button offers additional options for each job. These options are links and can be enabled or disabled depending on expanded job’s current status:
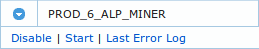
-
Disable link disables expanded job. Disabled jobs don’t run on schedule.
-
Start link starts expanded job. Runs job once, does not enable it if disabled.
-
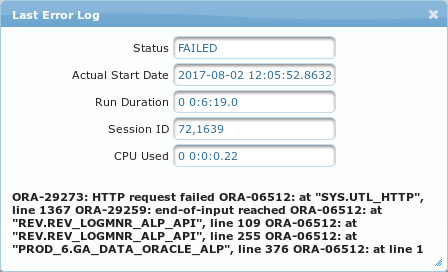
Last Error Log link opens popup window displaying expanded job’s last error log.
-
Job Name
-
Repeat Interval - job schedule parameters:
-
freq - how frequently a job is started.
-
interval - number of job runs within one interval.
-
byminute, byhour - in what minute in the hour or hour in the day the job is set to run.
-
-
Last Duration - how long job ran the last time it ran.
-
Elapsed - time until the job will run the next time.
-
Last Start - time when job was last started.
-
Runs - number of job runs. Disabling a job resets this counter to zero.
-
Fails - number of job fails.
-
Retries - number of job run retires after failure.
-
State icon representing current state of the job. Hover mouse pointer over the icon to display status information. The following statuses are possible:
-
 - SCHEDULED - job is enabled and scheduled to run
 -
- RUNNING - job is currently running
-
 - DISABLED - job is disabled
-
Users
This page is used for Arbiter GUI user and user group configuration.
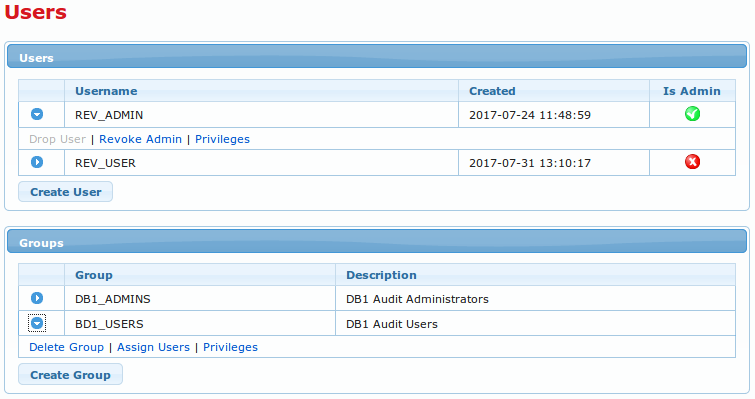
Page is split into two sections:
-
Users section for user administration.
-
Groups section for group administration.
Users section
First part of this section is list of all Arbiter GUI users in a table. With the following columns:
-
Expand button
. Pressing this button offers additional options for each user. The following options are available:-
Drop user link to drop user.
-
Revoke Admin or Grant Admin links:
-
Revoke Admin link is only available when user is administrator and is used to revoke user’s administrative privileges
-
Grant Admin link is only available when user is not is administrator and is used to grant user administrative privileges
-
-
Privileges link to manage database privileges for users. When this link is clicked new window called Privileges with the following options appears:
-
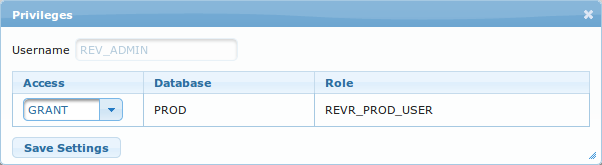
-
Username text filed containing username for the user whose privileges are being managed.
-
List of privileges in a form of table where each row represents one database. The following columns are available:
-
Access dropdown menu with
GRANTandREVOKEoptions to grant or revoke access to a database. -
Database text containing name of database to grant or revoke access to.
-
Role text representing role to be granted or revoked. Role name is database specific.
-
-
Save Settings
 button to save managed privileges.
-
Username.
-
Created username creation date and time.
-
Is Admin showing whether username has administrative privileges
 or not
  .
.
-
Beneath the table Create User button can be found. This button opens a new window called New user and is used for adding new users for Arbiter GUI.
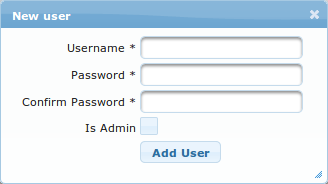
New user window consists of the following elements:
-
Username * input field to enter username for new user. Username is mandatory and has to be unique.
-
Password * input field to enter password for new user. Password complexity requires one number and one non alphanumerical character to be used. Password is mandatory and has to match Confirm Password.
-
Confirm Password * input field to re-enter password for new user. Confirm Password is mandatory and has to match Password.
-
Is Admin checkbox to select whether newly created user will be granted administrative privileges.
-
Add User button to complete user creation procedure.
Groups section
First part of this section is list of all Arbiter GUI user groups in a table. With the following columns:
-
Expand button
. Pressing this button offers additional options for each user. The following options are available:-
Delete group link to delete group.
-
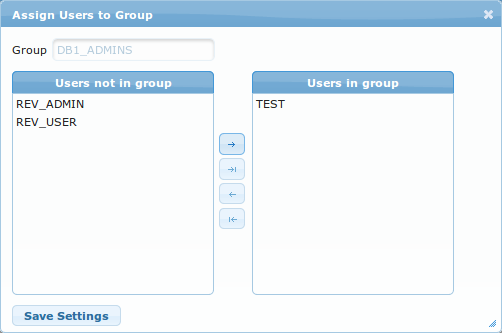
Assign Users link to assign users to a group. Clicking this link opens a new window called Assign Users to Group with the following elements:
-
Group text filed containing name of the selected group.
-
Users not in group list containing list of users that have not yet been assigned to the group being managed.
-
Users in group list containing list of users that are assigned to the group being managed.
-
List management buttons positioned between bots lists to transfer users between the lists:
-
Add button
 to add selected users from Users not in group to Users in group list.
 -
Add All
 button to add all users to Users in group list.
 -
Remove
 button to remove selected users from Users in group to Users not in group list.
 -
Remove All
 button to remove all users from Users in group list.
-
-
Save settings button to save users to group assignment.
-
-
-
Privileges link to manage database privileges for groups. When this link is clicked new window called Privileges that is the same as Privileges window for users described in Users section chapter. The only change is that the first element in the window is called Group instead of Username.
-
Group column containing group name.
-
Description column containing group description.
-
Beneath the table Create Group button  is located. This button opens a new window called New Group which is used for adding new groups.
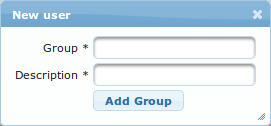
New group window consists of the following elements:
-
Group * input field to enter new group name. Group is mandatory and has to be unique.
-
Description * input field to enter new group description. Description is mandatory.
-
Add Group button to complete group creation procedure.
Logs
Logs page is used to display Arbiter jobs log files.
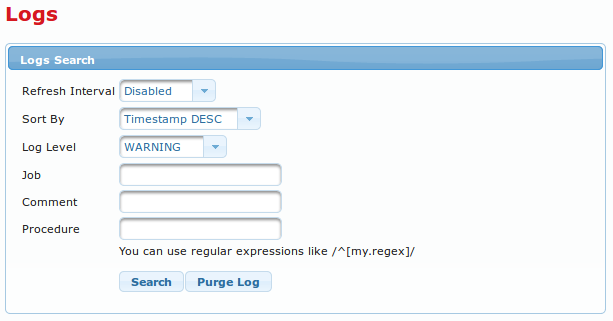
Page consists of Logs Search section. At the top of this section there is a log searching form. By default no logs are shown, they have to be queried. If log search finds any results they are displayed in a table below the search form.
Log search form consists of the following elements:
-
Refresh Interval dropdown menu to select time interval in seconds to refresh log search results. The following values can be selected
Disabled(default value),5,10,30,60. -
Sort By dropdown menu to select log results sort order. Values
Timestamp DESCandTimestamp ASCare available. -
Log Level dropdown menu to select the lowest log severity level to be returned as a result. All logs of selected severity level and above are displayed.
-
Job input filed to search logs by job name. Regular expressions can be used.
-
Comment input filed to search logs by their comment. Regular expressions can be used.
-
Procedure input filed to search logs by procedure name. Regular expressions can be used.
-
Search button
 to run log search.
 -
Purge Log button
 to purge log file.
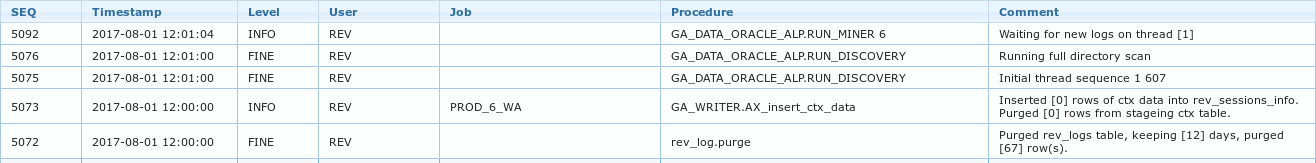
When log search returns results they are displayed in a table below search form with the following columns:
-
SEQ - log sequence number. Log sequence numbers are not lost after log purge.
-
Timestamp - date and time of log event.
-
Level - log severity level.
-
User - user that log has been created by.
-
Job - job that created log.
-
Procedure - procedure that crated log.
-
Comment - log additional information.
Each row of the table can be clicked to open a new window called Log Details showing detailed information for a selected log entry.
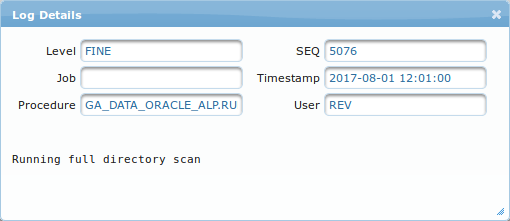
Log Details window consists of the following elements:
-
Level - log severity level.
-
Job - job that created log.
-
Procedure - procedure that crated log.
-
SEQ - log sequence number. Log sequence numbers are not lost after log purge.
-
Timestamp - date and time of log event.
-
User - user that log has been created by.
-
At the bottom of the window additional log information is shown.
DB Links
Arbiter can collect audit trail data via DB links to production databases. This page is used to manage these DB links.
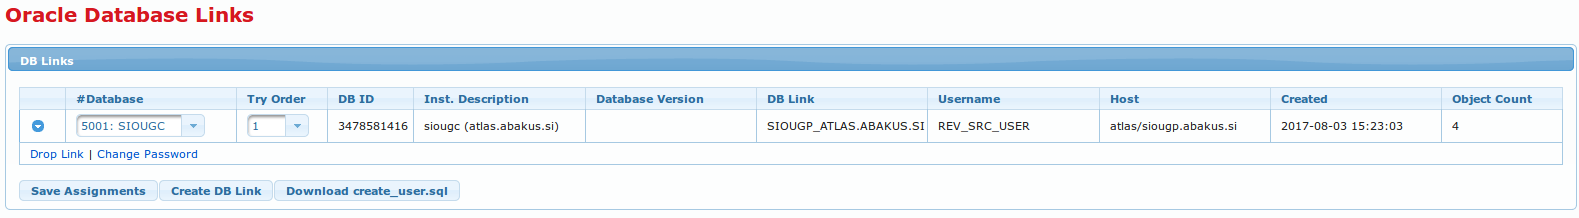
A table representing list of DB links is displayed on this page, it consists of the following columns:
-
Expand DB Link button
. Pressing this button offers additional options for each DB link:-
Drop Link link to drop DB link represented by the row. Link is deleted instantly!
-
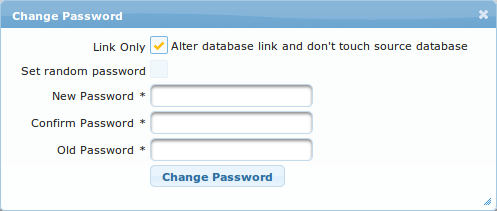
Change Password to change DB link password. Clicking this link opens a window called "Change Password". The windows consists of the following items:
-
Link Only checkbox. Check this checkbox to alter database link without touching source database. When this option is selected, Set random password checkbox is disabled.
-
Set random password checkbox to randomly generate new password. When this checkbox is selected, New Password and Confirm Password input fields are disabled. When this option is checked Link Only checkbox is disabled.
-
New Password input field for new password.
-
Confirm Password input field for confirming new password, this has to match New Password.
-
Old Password * input field for existing DB link password.
-
-
-
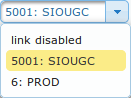
#Database dropdown menu to select Arbiter’s database to be used by this DB link. Dropdown menu also offers an option to disable individual DB links by selecting
link disabledoption.
-
Try order production database can have more that one instance and Arbiter can connect to all of those instances via multiple DB links. This value sets priority of each of those links where lower value means higher priority.
-
DB ID production database identifier that was generated during database creation.
-
Inst. Description production instance name / production server hostname.
-
Database Version displays information on DB software version.
-
DB Link name.
-
Username DB link username.
-
Host hostname of computer hosting database that is the source of audit trail data / service name.
-
Created data and time of running create_user.sql script on production database.
-
Object Count number of objects residing in production scheme belonging to user created by create_user.sql script.
-
Save Assignments button
 to save values of #Database and Try Order dropdown menus.
 -
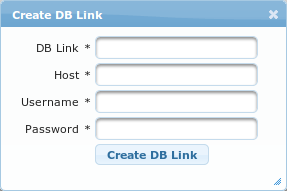
Create DB Link button
 button to create new DB link. This button opens a window called Create DB Link with the following elements:
-
DB Link* name.
-
Host* production database server hostname.
-
Username* username to access production database.
-
Password* password to access production database.
-
Create DB Link button
to add new DB link to the list.
-
-
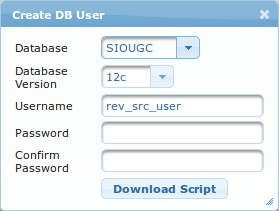
Download create_user.sql button
 . This procedure allows downloading DB user creation script that can be run on production database. This button opens a window called Create DB User containing:
-
Database dropdown menu with the list of available Arbiter databases.
-
Database Version dropdown menu to select database software version.
-
Username input field to enter username to be created.
-
Password input field to enter password for the new user.
-
Confirm Password input field to confirm password fir the new user. This has to match the value of Password.
-
Download Script button
 to complete the procedure. After clicking this button user is prompted to open user creation script. This script has to be run in production database environment.
-
Settings
Settings page is used to configure various Arbiter settings. Settings are divided into groups of settings that go together. Each groups of settings is displayed on separate tab. The following tabs are available: Core, Db Specific Settings, Export Import, Jobs, Logging, Password Policy and Supervisor.
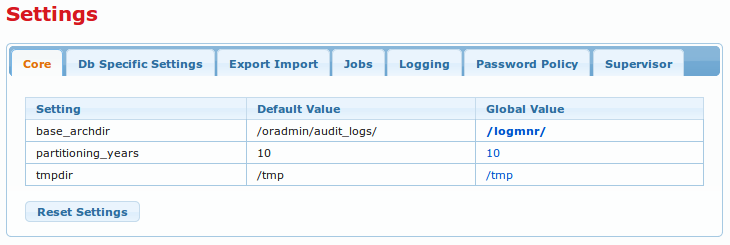
Each tab displays all settings available for its group of settings in form of table. Each row represents one individual setting. Setting tables have three or more columns depending on the settings group selected and number of databases registered within Arbiter:
-
Setting - setting name.
-
Default Value - default setting value.
-
Global Value - global custom setting value.
-
<DB_COMMON_NAME> - registered database common name as displayed on databases list described in Databases section of Databases chapter. This column holds database specific settings which can be set per Arbiter registered database. There is one <DB_COMMON_NAME> column for each registered database. These columns are only displayed in those settings groups that apply to registered databases.
-
Reset Settings button
 to reset all specific settings in selected settings group to default values.
Default settings can not be changed. Global and database specific settings can be changed by clicking links represented by values of the setting in tables of settings. Clicking these link opens new windows called Change Setting. For each individual setting a window opens with the following elements:
-
Setting name
-
Setting description - this manual does not contain in detail settings descriptions because Change Setting windows already contain detailed descriptions.
-
Setting value domain
-
Setting default value
-
Some kind of input field to enter setting value. The type of input field depends on setting value type.
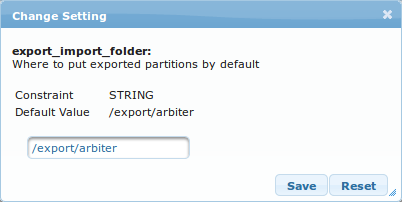
Export / Import
When audit trails have to be stored for long periods of time it is advisable to compress old data and store onto long term storage devices to release Arbiter’s data storage capacity. This page is used to export Arbiter’s database to an external archive and import previously exported Arbiter data back into Arbiter’s database when old data needs to be queried.
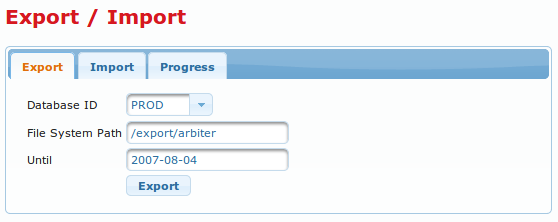
Page is divided into three tabs:
-
Export tab used for exporting Arbiter’s data.
-
Import tab to import previously exported data.
-
Progress tab that shows current export / import operation status.
Export tab
Using this tab current Arbiter’s data can be exported and archived into files for long term off-site storage.
Tab contains the following elements:
-
Database ID dropdown menu to select which database data will be exported.
-
File System Path input field to configure where archive files will be created.
-
Until date input field to set up until which date audit trail data will be exported into files.
-
Export button
 to start export procedure.
Import tab
Using this tab previously exported Arbiter’s audit trail data can be imported back into Arbiter’s database so it can be queried.
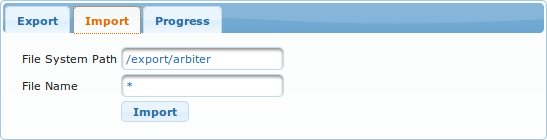
Tab contains the following elements:
-
File System Path input field to configure where archive files to be imported are located.
-
Filename input field to filter which files located on File System Path are to be imported (use * to import all files on File System Path).
-
Import button
 to start export procedure.
Progress tab
This tab displays information on current export of import procedure progress.
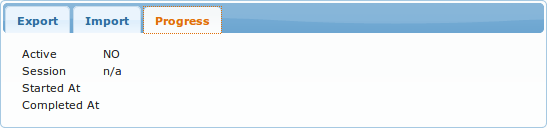
Tab contains the following elements:
-
Active indicated whether currently an export or import procedure is active.
-
Session
-
Started At shows when currently running procedure was started
-
Completed At shows when last procedure has finished running.
GUI Sessions
This page shows information about Arbiter GUI sessions. Arbiter can also track logon and logoff events to its own GUI and show those data on this page.
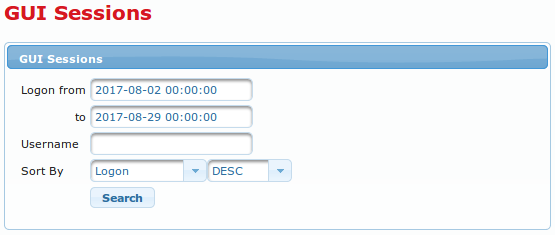
Page consists of GUI Sessions section. At the top of this section is a search form. By default no GUI sessions information is shown, data has to be queried first. If search finds any results they are displayed in a table below the search form.
GUI sessions search form consists of the following elements:
-
Logon from date and time from which search will start looking for GUI sessions information.
-
to date and time up until which search will look for GUI sessions information.
-
Username username which to search GUI session information for.
-
Sort By input filed to search logs by job name. Regular expressions can be used.
-
Sort column name dropdown menu containing the following options
Logon,Logoff,Last action,Username,Remote IP,Remote host.
-
-
Sort direction dropdown menu
-
Search button
to run log search.
When log search returns results they are displayed in a table below search form with the following columns:
-
SEQ - log sequence number. Log sequence numbers are not lost after log purge.
-
Timestamp - date and time of log event.
-
Level - log severity level.
-
User - user that log has been created by.
-
Job - job that created log.
-
Procedure - procedure that crated log.
-
Comment - log additional information.